
No software to buy
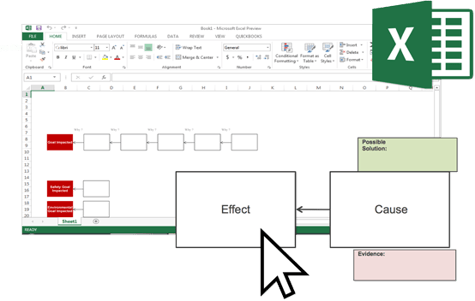
You don’t need expensive proprietary software to solve and document your problem investigations. Microsoft Excel is all you need.

Simple to use
The built-in drawing tools are intuitive and allow you to visually capture cause-and-effect relationships with boxes and arrows.

Easy to share
With the widespread use of Excel, files are easy to share and edit by anyone in your organization.
 Cause Mapping® template resources
- - - - - - - - - -
We make it easy to get started. Look through our blog and historical case studies to see additional Cause Map examples. Our summary videos also demonstrate the Cause Mapping® process and provide tips for using Excel. Let us know how we can help by contacting us. We’ll be happy to address any questions you may have.

Excel Videos
- - - - - - - - - -
View our Excel video library and get tips for using Microsoft Excel to visually document cause-and-effect relationships.

Free Webinars
- - - - - - - - - -
Register today to reserve your seat in one of our free LIVE Webinars. Each session is packed full of useful information and tips for facilitating better investigations.

Attend a workshop
- - - - - - - - - -
View our selection of workshops specializing in Cause Mapping® methodology and other topics related to risk and reliability.