Cause Mapping® Root Cause Analysis
- - - - - - - - - -
Cause Mapping root cause analysis improves the way people analyze, document, communicate, and solve problems. In many companies, problem solving is a confusing maze of different tools, baffling terms, and puzzling categories. An investigation should make a problem clearer, not more complicated. Cause Mapping demystifies root cause analysis. It’s an uncomplicated approach, grounded in the basics, that people find easy to learn and straightforward to apply. Cause Mapping root cause analysis leverages fundamental principles to improve both the effectiveness and efficiency of problem solving. Three key principles of Cause Mapping root cause analysis are:
-
Systems approach
Reveal the system of causes to mitigate risk.
-
Visual communication
Take advantage of the power of visual communication.
-
Simple and effective
Don’t stray from the basics.

 A problem well defined is a problem half solved
- - - - - - - - - -
A clearly defined problem is an important step of the problem-solving process. Without a clear problem statement, people can drift off course, waste valuable time, and miss opportunities to solve the problem. The “problem” with defining problems is that everyone has a different perspective on what the “real” problem is. Cause Mapping root cause analysis uses a structured problem outline that reveals 3 key benefits to effective problem solving. A well-defined problem at onset will help you avoid the common pitfalls that can derail your investigations.
Three key benefits of a well-defined problem:
- Problem alignment
- Total impact – gaps & risks
- Guidance on level of detail for analysis
Download our FREE Cause Mapping® template
No special software required! Learn how to leverage root cause analysis across your organization using Microsoft Excel

 What is a Cause Map™?
- - - - - - - - - -
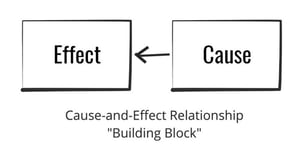
A Cause Map diagram provides a visual explanation of why an incident occurred. It connects individual cause-and-effect relationships to reveal the system of causes within an issue. A Cause Map diagram can be very basic or it can be extremely detailed depending on the issue.
 How to read a Cause Map™
- - - - - - - - - -
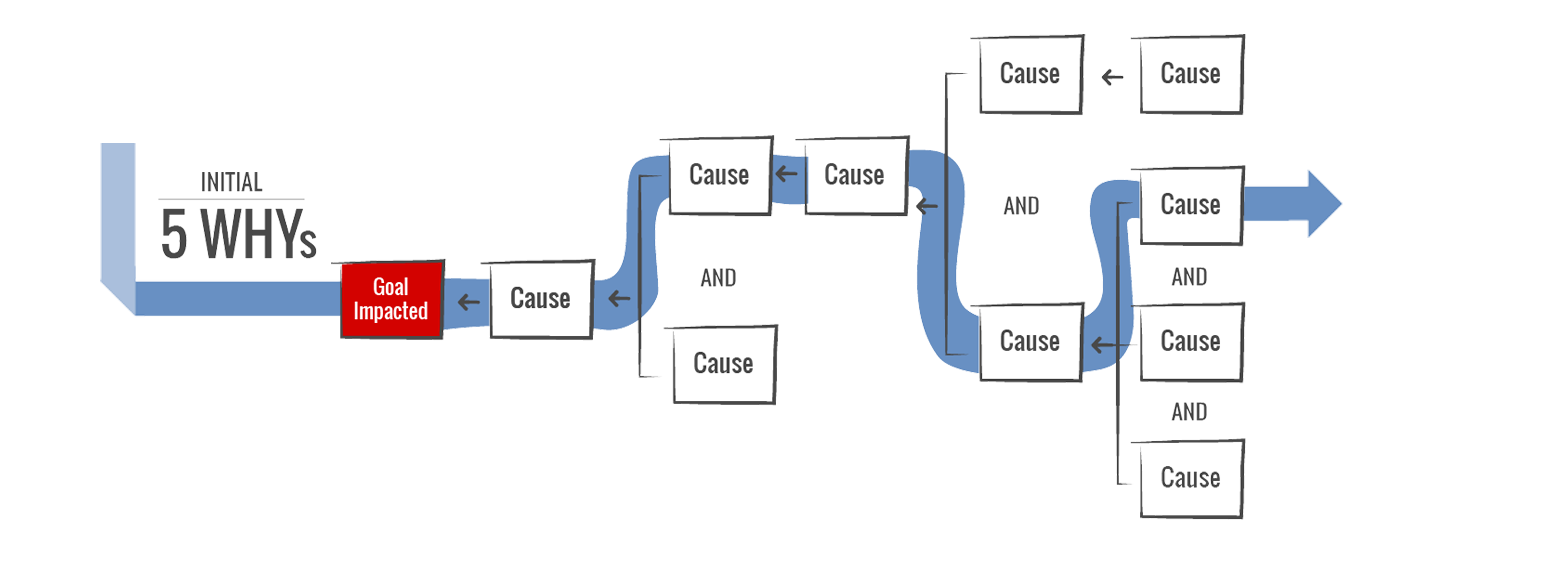
Start on the left. Read to the right saying “was caused by” in place of the arrows. Investigating a problem begins with the problem and then backs into the causes by asking Why questions. The questions begin, “Why did this effect happen?” The response to this question provides a cause (or causes), which is written down to the right.
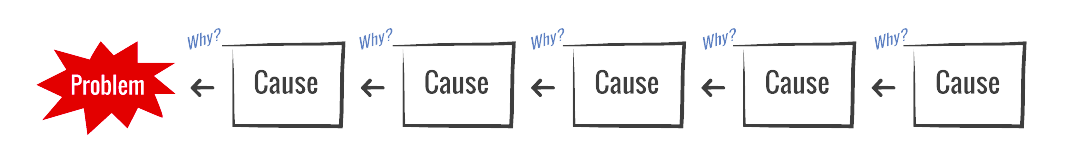
The next question is again, “Why did this effect happen?” The cause that was written down last becomes the effect for the next Why question. Anyone who’s ever had a three-year-old in their life will immediately recognize how Why questions change a cause into an effect. This is fundamentally how causes and effects link together to create a chain of events. Writing down 5 Whys, as shown below, is a great way to start an investigation because it’s so simple.
In Cause Mapping root cause analysis, a problem within an organization is defined as a deviation from the ideal state. A Cause Map diagram always begins with this deviation, which is captured as the impact to the organization’s overall goals.
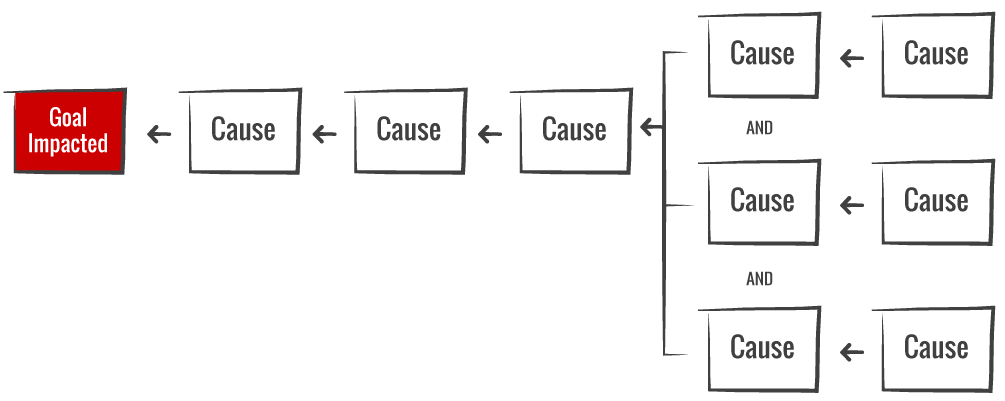
In addition to the standard Why questions, which tend to create linear cause-and-effect relationships, the Cause Mapping root cause analysis also asks “What was required to produce this effect?” Anything that is required to produce an effect is a cause of that effect. This question, “What was required?,” allows you to build a detailed Cause Map diagram that provides a more complete representation of the actual issue.
 Why does the Cause Map™ diagram read left to right?
- - - - - - - - - -
It should be noted that the popular fishbone cause-and-effect diagram starts with the problem on the right and builds the causes to the left. It was created by Kaoru Ishikawa (1915-1989) in Japan. The fishbone diagram builds from right to left because the Japanese language reads from right to left. Cause Mapping root cause analysis actually uses Ishikawa’s convention by asking Why questions in the direction we read. The fishbone is widely recognized as one of the standard quality tools. Ishikawa was a pioneer with his approach. The fishbone cause-and-effect diagram is part of every Six Sigma program. A Cause Map diagram builds on the original lessons with the fishbone with some subtle but important distinctions.
How does the Cause Map™ diagram differ from the fishbone approach?
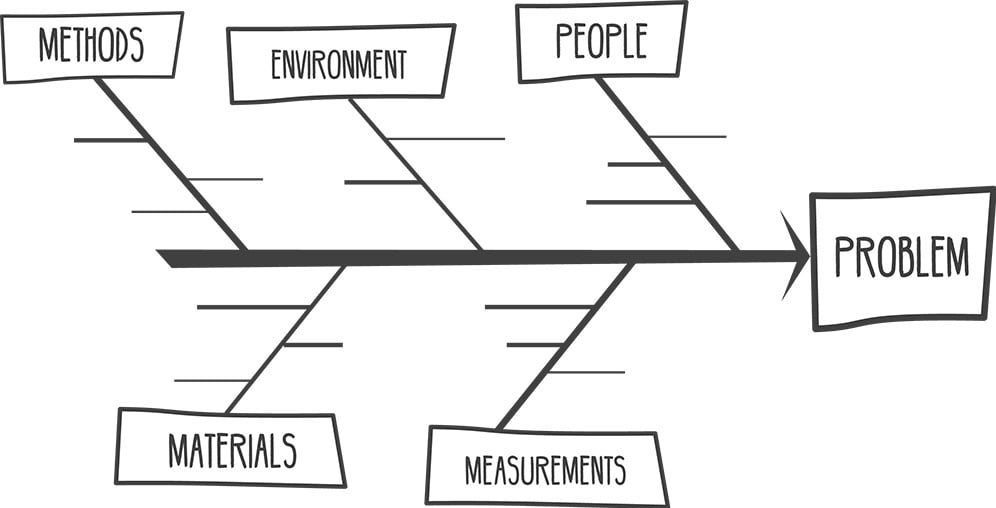 A fishbone starts with just one, single problem, which doesn’t reflect the nature of real-world issues. It reads right to left because the Japanese language reads that direction. It mixes causes and possible causes without specifying evidence. And, it breaks apart the fundamental cause-and-effect relationships within an issue by grouping the causes into general categories.
5-Whys on a Cause Map™ diagram
The 5-Why approach is an excellent example of basic cause-and-effect analysis. Just as a journey of a thousand miles begins with the first step, every investigation, regardless of size, begins with one Why question. The Why questions then continue, passing through five, until enough Why questions have been asked (and answered) to sufficiently explain the incident. The 5-Why approach, created by Sakichi Toyoda (1867 – 1930), the founder of Toyota, is a simple way to begin any investigation. A Cause Map diagram can start with just one Why question and then expand to accommodate as many Why questions as necessary. Some refer to Cause Mapping root cause analysis as “5-Whys on Steroids.”
Some causes are linked with “AND” in between
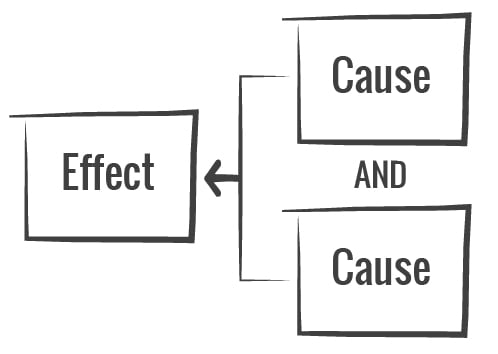 ANDs show where more than one cause is required. When an effect has more than one cause, both causes are placed on the Cause Map diagram. Each cause is connected to the effect with AND placed in between. These causes are independent of each other, but they are both required to produce that effect. An AND is needed when people provide different, yet valid, explanations of a cause. People think of cause-and-effect as a simple one-to-one relationship: an effect has a cause. In reality, every effect has causes.
Cause Mapping® Workshops
View our selection of workshops specializing in Cause Mapping root cause analysis and other topics related to risk and reliability — available as public workshops, on-site training, or online.