Overview:
Over the course of two days, a U.S. airline placed an unaccompanied minor on the wrong flight on two different occasions. On June 13th, a child flying alone and under the supervision of the airline was scheduled to fly from Houston to Charlotte. Instead, she ended up in Fayetteville. One day later, a second occurrence with the same airline, this time out of Boston. Instead of going to Cleveland, this unaccompanied girl ended up in Newark, NJ. This root cause analysis focuses on the failures that occurhred within the work processes and emphasizes the use of process maps to help identify where the breakdowns occurred and how to identify specific solutions to prevent re-occurrence.
A Root Cause Analysis of the Unaccompanied Minor Flown to Newark Instead of Cleveland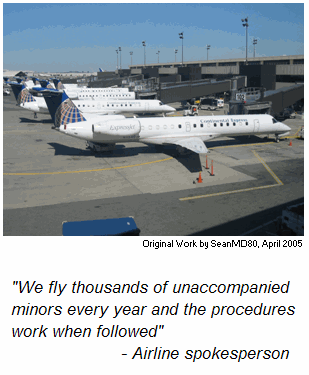 This analysis focuses on the second incident that occurred on Sunday, June 14th. The child was suppose to fly from Boston to Cleveland. Instead, she ended up in Newark, NJ. Click here to see the news report.
In response, the airline indicated that the reason for the mix-up was that two flights were departing simultaneously from a single doorway and miscommunication among staff resulted in the children being placed on the wrong plane. The solution they provided was “Reinforce our procedures with our employees.” As you can see in the basic cause map below, this is simple and generic solution to simple analysis.
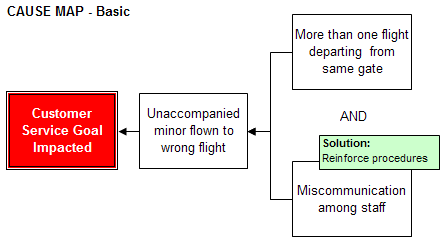
The solution “Reinforce procedures” sounds like a great idea and appears to solve the problem. After all, they fly thousands of unaccompanied minors every year and the procedures work when followed. However, I would caution that the solution is not specific enough to actually prevent the problem from reoccurring. To significantly reduce future risk, the investigation must drive into the specific breakdowns within the processes, and in this case there were multiple breakdowns that occurred.
The easiest way to investigate process breakdowns is to start by visually capturing the process flow. As you begin to walk through the process in a visual format, it is much easier to speak in more detail about what didn’t go well within the process. For example, below is a generic process map for escorting a minor to the correct plane and notes indicating where there was a breakdown in the process.

A second process that failed is the passenger counting process on the flight to Cleveland (the plane she was supposed to be on). Since the minor was checked in when her boarding pass was scanned, counting the number of passengers on the plane should have indicated that someone was missing.

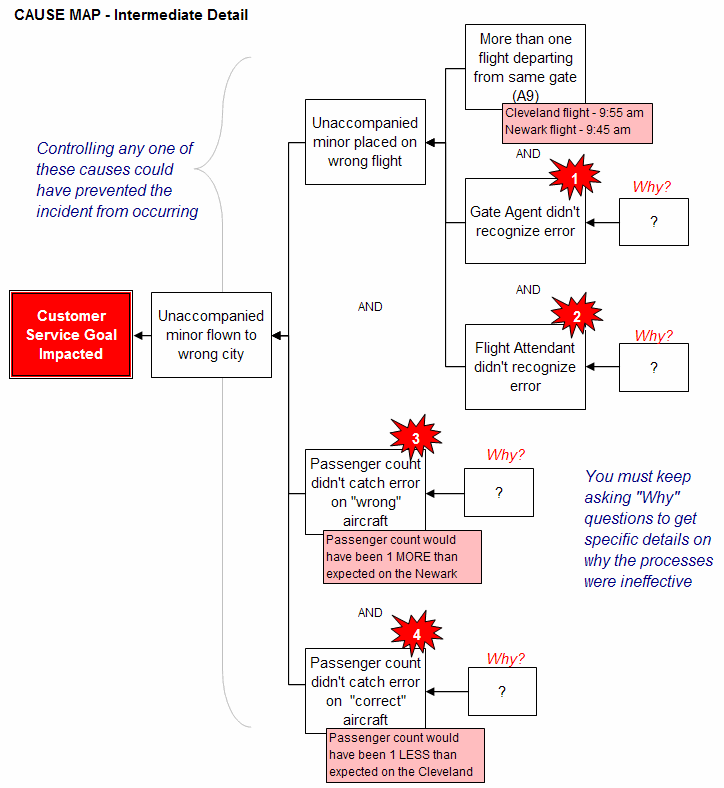
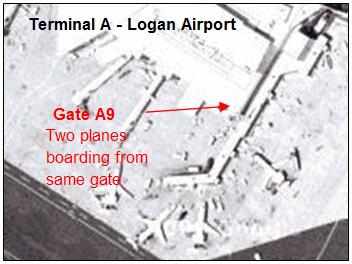 As you can see in the above process maps, there are at least four breakdowns that occurred (each is numbered). The next question of course is “Why?”. Why were the errors made and the checks ineffective? Why didn’t the passenger counting process catch the error? To facilitate these question, we can now begin to capture the details on the cause map. On the cause map below, we can easily show all of the breakdowns that had to occur in order for the system to fail. Before we can identify the specific solutions needed to prevent re-occurrence, we would need to continue adding more detail as the map below requests. In other words, we would need to keep asking the why questions for each path and talk with the specific people involved to get the details. Only then will we have conducted a thorough root cause analysis and be able to identify specific changes in the work process to prevent this incident from happening again.
Detailed Cause Map
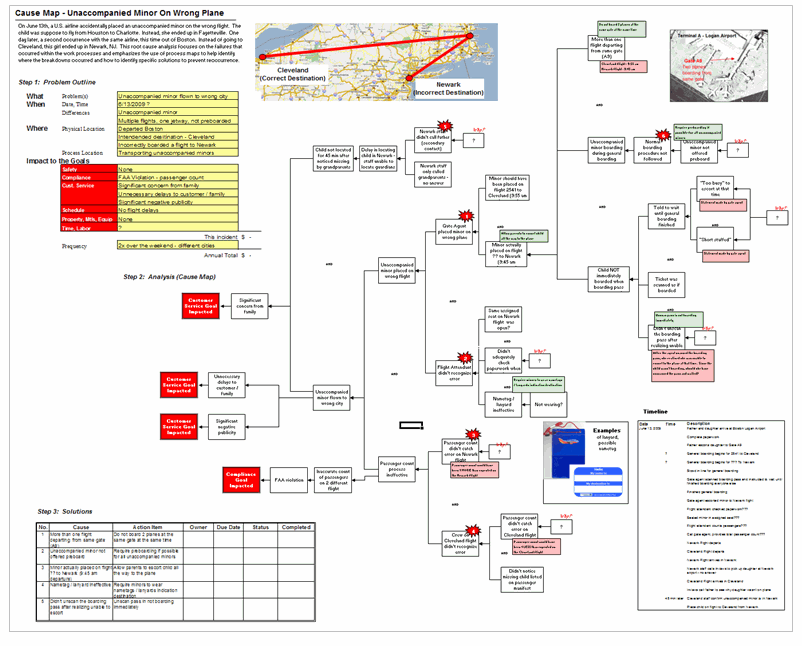
This is a the detailed root cause analysis for this issue. This one piece of paper (poster) contains a comprehensive explanation of what happened and why as well as specific solutions to reduce the risk of it occurring again. It contains:
Problem Outline – definition of the problem including the risk to the goals
Cause Map – a detailed cause-and-effect analysis revealing everything that had to happen to produce this issue
Timeline – the sequence of events
Diagrams – visuals that show the route, layout of the gate at the airport and related photographs
Solutions – The green boxes located above particular causes are specific solutions to prevent the incident from occurring again.
Bring Cause Mapping® Root Cause Analysis training to your site
Schedule a workshop at your location to train your team on how to lead, facilitate, and participate in a root cause analysis investigation.
