This is an example of how Cause Mapping root cause analysis can be applied to the sinking of the Titanic. Each of the Cause Mapping steps are explained below:
1) Define the problem
2) Analyze the causes
3) Select the best solutions.
Step 1. Define the Problem
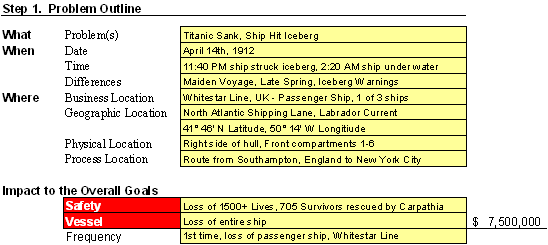
The first step of the Cause Mapping method is to define the problem by asking the four questions: What is the problem? When did it happen? Where did it happen? And how did it impact the goals? One person may say that the problem was the Titanic sank. Another person might say that the problem was that it hit an iceberg, and a third person could say that the problem was it filled with water. We can write down these three “problems” on the first line. In the Cause Mapping method, the facilitator anticipates that the group may disagree so all three responses are written down. There is no need to spend time debating the problem. The magnitude of an incident is defined by the impact to the goals.

The second question is the “When?” which is the date and time of the incident. When captures the timing of the issue and also has a line for what was different or unusual in this occurrence. The question of what was different is fundamental in any investigation. On the Titanic issue, we capture the date as April 14th, 1912 and the times of 11:40 PM when the iceberg was hit and approximately 2:20 AM on the morning of the 15th when the ship was under the surface.
In an investigation, there can be several pieces of information that need to be captured when specifying the location. At a minimum, the physical/geographic location and the process location should be captured. On the Titanic incident, there is first a business location that contains the name of the company and the business. The geographic location is where geographically the incident happened which in this case includes latitude and longitude. The physical location is the right side of the hull that struck the iceberg and compartments 1 through 6 are specified. The process location defines where in the process this incident occurred.
The next section is the impact to the overall goals. On a passenger vessel one of the overall goals is to have zero injuries. On the Titanic, there were over 1500 fatalities of the 2200+ that were on board. One of the other goals is to have no damage to the vessel. In the case of the Titanic, the entire vessel was lost. There were other goals that were affected but the magnitude of the loss of life makes the loss of the vessel and any other goals less significant. The two goals that are impacted in the Titanic example are the safety goal and the vessel goal.
Step 2. Identify the Causes (The Analysis)
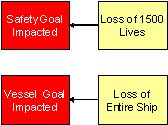
The analysis step is where the incident is broken down into causes which are captured on the Cause Map. The Cause Map starts by writing down the goals that were affected as defined in problem outline. For the Titanic the safety goal was impacted because of the 1500 lives that were lost and the vessel goal was impacted because the entire ship was lost. These are the first two cause-and-effect relationships in the analysis.

The analysis can continue by asking Why questions and moving to the right of either of the cause-and-effect relationships above. In this example, we’ll start with the Loss of 1500 lives which was caused by the Titanic sinking. The next question is “Why did the Titanic sink?”

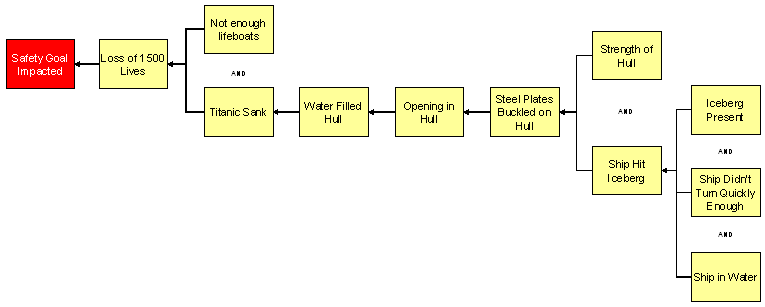
Typical responses to this question are because it hit an iceberg and because it filled with water. Even though there are two different answers to this one question both of the responses are valid and can be added to the Cause Map. The Titanic sank because it filled with water. The ship filled with water because the steel plates buckled on the hull which was due to the ship hitting the iceberg.

For the steel plates to buckle on the hull there had to be some stress applied to the hull, which is the ship hitting the iceberg, and the steel had to have some strength. In the case of the Titanic, the strength steel and hull was not sufficient to prevent the hull from being breached by the steel plates buckling. The cause-and-effect relationships for the steel plates buckling because of the stress and the strength are shown on the following Cause Map.

Since the strength of the steel and the force of the ship hitting the iceberg were both required for the steel plates to buckle on the hull either one of the causes can be controlled to prevent the effect from occurring. Even if the ship did hit the iceberg, the steel would have to have been stronger. Controlling either one of the causes prevents the effect from occurring which really means reduces the risk of the effect occurring.
The next Cause Map shows some of the causes of the ship hitting the iceberg and why 1500 people died.

This previous Cause Map shows that the loss of life was because the Titanic sank and there were not enough lifeboats available on the ship. Even if the Titanic sank in the same manner that it did, adding more lifeboats would have reduced the risk of 1500 people dying. Even one additional lifeboat reduces the risk by a small amount. Adding a sufficient number of lifeboats for everyone onboard the ship significantly reduces the risk of losing passengers.
There are also three causes identified for the ship to hit the iceberg. The iceberg had to be in the path of the ship, the ship had to be in the water and the ship had to not turn enough to miss the iceberg. All of the causes were required to produce the effect ship hit iceberg. Controlling any one of the causes, such as turn ship sufficiently reduces the risk the ship hitting the iceberg which also reduces the risk of 1500 people dying. As unusual as it may sound some people may argue that if the Titanic was never put in the water the ship wouldn’t have sunk. People are willing to argue the point because it is true. Disagreeing with this person creates an unnecessary debate that may take several minutes. Taking 15 seconds and adding the cause on to the Cause Map and then continuing to add more detail to the analysis is a more effective approach.
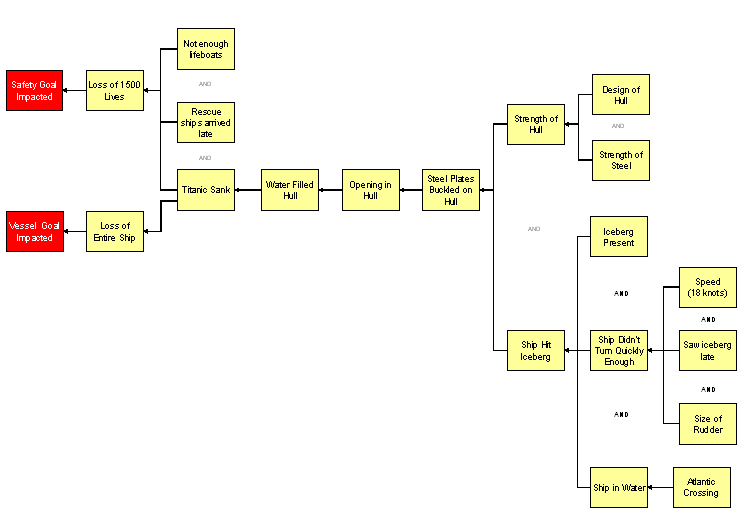
The following Cause Map shows that the Titanic sinking also causes the loss of the entire ship which impacts the goal of not damage to the vessel. More detail has been added to the strength of the steel to show that the strength of the hull is a function of not only the design of the hull but the strength the steel that was originally identified. The ship didn’t turn sufficiently because of the speed of the ship, the fact that iceberg was seen too late and the size of the rudder. The simple cause-and-effect relationship of the Titanic sank because it hit an iceberg is accurate; it’s just not as thorough as the more detailed Cause Map. Organizations that don’t know how to break a problem down into specific cause-and-effect relationships mistakenly oversimplify a complex incident by providing solutions such as “don’t hit icebergs.”


Even more detail can be added to this Cause Map as the analysis continues. As with any investigation, the level of detail in the analysis is based on the impact of the incident on the organization’s overall goals. The Titanic incident was investigated by the United States and the United Kingdom because of the significant loss of life. The International Maritime Organization implemented specific action items that became the Safety of Life at Sea (SOLAS) guidelines after the Titanic tragedy. The specific action items from the Titanic can be matched to specific causes on the detailed Titanic Cause Map. A detailed Cause Map of the Titanic incident with over 100 causes can be found on ThinkReliability’s web page.
Step 3. Select the Best Solutions (Reduce the Risk)
Once the Cause Map is build to a sufficient level of detail with supporting evidence the solutions step can be started. The Cause Map is used to identify all the possible solutions for a given issue so that the best solutions can be selected. It is easier to identify many possible solutions from the detailed Cause Map than the oversimplified high-level analysis of “Titanic sank because the ship hit the iceberg.”
 There are causes to every issue. The Titanic tragedy at a high level has only one cause. At a more detailed level, it has 5 causes, 19 causes, and 115 causes. All of the levels of the Cause Map are accurate some simply have more detail than others. An issue should be worked to a sufficient level of detail to prevent the incident; meaning to reduce the risk of the incident occurring to an acceptable level. This is why solutions and work processes at a coffee shop are not as thorough or detailed as an airline or nuclear power facility. The risk or impact to the goals dictates how effective the solutions should be. Lower risk incidents will have relatively lower detail investigations while significantly high risk to an organization’s goals requires a much more thorough analysis.
Cause Mapping Improves Problem Solving Skills
The Cause Mapping method focuses on the basics of the cause-and-effect principle so that it can be applied consistently to day-to-day issues as well as catastrophic, high-risk issues. The steps of Cause Mapping are the same, but the level of detail is different. Focusing on the basics of the cause-and-effect principle make the Cause Mapping approach to root cause analysis a simple and effective method for investigating safety, environmental, compliance, customer, production, equipment or service issues.
Titanic Cause Map Poster- Root Cause Analysis That Fits On Your Wall
Because the Cause Mapping approach to root cause analysis draws its power by virtue of being so visually appealing and easy to understand, we have produced a poster of the Titanic Cause Map, containing a basic and detailed analysis of the accident. While the basic Cause Map starts with five Why questions, the detailed analysis of the Titanic accident contains over 115 cause-and-effect relationships. The solutions from the actual investigation are located above the particular cause it controls and are additionally summarized in a numbered table. To order your own Titanic incident poster, click here.
Bring Cause Mapping® Root Cause Analysis training to your site
Schedule a workshop at your location to train your team on how to lead, facilitate, and participate in a root cause analysis investigation.
