
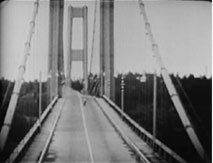
The original Tacoma Narrows Bridge was opened for traffic on July 1, 1940. The suspension bridge spanned over a mile and had a unique, slender design. The bridge quickly became nick named “Galloping Gertie” because it experienced large up and down movement on windy days.
On the morning of November 7 1940, the movement of the Tacoma Narrows bridge changed from the usual longitudinal motion to a never before seen twisting mode. The peak twisting motion of the roadbed is estimated to have been 25 ft from crest to valley. The bridge was closed to traffic due to the unsafe conditions. The violent twisting motion continued to increase for about an hour until the suspender cables snapped and 600 ft of the roadbed was dropped into Puget Sound below. The Tacoma Narrows Bridge was destroyed a little more than four months after it opened.
The Cause Mapping Method
The Tacoma Narrows Bridge can be used as an example of how the Cause Mapping method can be applied to a specific incident. The three steps in the Cause Mapping Process are 1) Define the problem, 2) Analyze the causes and 3) Select the best solutions. Each step will be discussed below.
Step 1. Define the Problem
The first step of the Cause Mapping approach is to define the problem by asking four questions: What is the problem? When did it happen? Where did it happen? And how did it impact the goals? The answers to these questions are documented in an Outline. When asked “What is the problem?”, people may give different answers. In this example, people may say the problem is the bridge collapsed or the bridge moved in the wind. There is no need to debate which is the right answer because all the answers are relevant. Write down all the different answers to the question on the first line of the Outline so the investigation can continue without wasting time debating.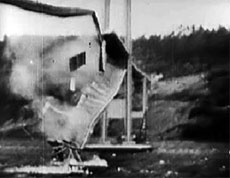
In answering the second question “When did this problem happen?”, the date and time of the incident should be documented as well as any differences that were present. The question of what is different is fundamental to any investigation and can provide clues as to why the failures occurred. In this example, the date is November 7, 1940 and the time is about 10 am. The differences were that it was a particularly windy day and that the design of the bridge was very narrow relative to length compared to similarly designed bridges.
In an investigation there can be several pieces of information that need to be captured when specifying the location. At a minimum the physical/geographic location and the process location should be captured. For this example, the physical/geographic location of the bridge is that it spanned the Puget Sound, 8 miles west of Tacoma. The process location is that the bridge was in service. In some cases, there may also be a business location, where the name of the company and the business is listed. The Outline can be modified as needed to document any relevant location information.
The final question is to define the impact to the overall goals. The overall goals reflect the ideal state of an organization. The list of overall goals can be modified to be representative of the goals of any company, but the goals should represent the goals of the whole company and shouldn’t change for each division within a company. This section should be used to record potential impacts to the goal in addition to actual impacts to the goals. For example in the case of Tacoma Narrows Bridge, one of the goals is the safe transport of all passengers. In this specific case, no one was injured, but there was a potential for injuries. A second goal of a bridge is to provide transportation. The bridge was destroyed and unable to be used so that is listed as an impact to transportation goal. Under the Production-Schedule goal the loss of revenue from tolls is listed. Under the Material, Labor goal, both the costs of salvaging the old bridge and constructing a new bridge are listed.
The final piece of information documented on the Outline is the frequency of the incident. This indicates how often this has occurred or is likely to occur. The frequency is a multiplier that helps us to understand the total magnitude of an issue.
Below is a completed Outline for the Tacoma Narrows bridge example.
Step 2. Conduct the analysis
During the analysis step, the main question asked is “Why did this happen?”. To answer the question, the incident is broken down into causes which are captured on the Cause Map. To begin creating a Cause Map, start by writing down one of the goals that was impacted. When the Cause Map is completed, all the goals with their associated causes will be listed on the Cause Map, but it is usually simplest to start building the Cause Map with a single goal. The goal is listed in a red box and the first cause will be the impact to the goal that was listed on the Outline. A Cause Map can be read left to right by putting the words “was caused by” between the boxes.
For this example, the Transportation goal was selected to begin building the Cause Map. This is what the first cause-and-effect relationship would look like.
The next cause on the Cause Map is added by asking “why” the bridge was a complete loss. Keep asking “why” questions and adding boxes to the right. This is what the Cause Map could look like after asking three more “why” questions.
While the above Cause Map is accurate, it is a simplified analysis. Detail can be added to the Cause Map in a number of ways. The Cause Map can continue to be built left to right by asking why questions and adding causes. Causes can be added in between existing Causes by taking smaller steps when asking why questions. Causes can also be added vertically. Many effects required more than one cause to happen. To determine if additional causes should be added vertically, ask “Is this cause sufficient (on its own) to produce the effect? If the answer is no, more causes should be added. To check if a cause is documented appropriately, ask “Is the cause necessary to produce the effect?” If the answer is yes, the cause is documented correctly. If the answer is no, the cause should not be included.
Below is the Tacoma Narrows Bridge Cause Map with additional detail added. Additional causes have been added to the right of the cause map, a cause “suspender cables broke” has been added between existing causes, and a cause has been added vertically. In this example, 42 mph wind had to occur for high amplitudes of the deck to occur and the bridge deck also had to be weak in torsion. If the bridge was strong in torsion, the wind would not have been able to move the bridge deck. Both causes were necessary for the effect to occur so both are listed vertically and separated with an “and”.
As much detail as needed can be incorporated by continuing to add causes. As with any investigation the level of detail in the analysis is based on the impact of the incident on the organization’s overall goals. The greater the impact to the goals, the more detailed the Cause Map will be.
Additionally, each impacted goal should be added to the cause map. Using the same method as before, each impacted goal should be listed in a red box and cause map build by asking “why” questions. This should continue until the point where each goal connects to a cause already documented on the initial Cause Map. The causes for each impacted goal should lead back to a cause already listed on the main cause map, otherwise the impact to the goals may have occurred from two separate incidents and the Outline should be revisited.
Below is the Tacoma Narrows Cause Map with all impacted goals added to the analysis.
To help document and visualize the analysis, evidence can be documented directly on the Cause Map. The typical way to do this is to state the evidence in a pink box under the Cause the evidence supports. There can be many sources of evidence. Evidence may be a statement or testimony, diagram, historical trend, experiment or test, etc. Any piece of information that furnishes proof of a cause can be documented on the Cause Map.
During an investigation, additional evidence may disprove a particular cause. When this happens, the evidence that disproves the cause is placed below the cause and the cause is crossed out, but not removed from the cause map. This helps document causes that were considered, but ultimately determined not to be related to the incident. In the Tacoma Narrows Bridge example, a cause that was considered was wind blowing at the natural frequency of the bridge causing resonance to occur. This theory was disproved, but it still remains a common misconception. To document that this was considered and rejected, the cause should be put included on the Cause Map and crossed out. Evidence that disproves the cause should also be included.
Below is an example of how an evidence block would look on the Tacoma Narrows Cause Map. In this case, eye witnesses and video of the bridge collapse validate that the suspender cables broke causing the bridge to collapse.
Once the Cause Map is built to a sufficient level of detail with supporting evidence, it can be used to develop solutions. The Cause Map is used to identify all the possible solutions for given issue so that the best solutions can be selected. It is easier to identify many possible solutions from the detailed Cause Map than the oversimplified high level analysis.
This example shows what the Cause Map looks like with 47 causes, evidence blocks and some possible solutions added.
Why did the Bridge Collapse?
Now that the analysis is completed, the question “Why did the bridge collapse?” can be answered. As the Cause Map demonstrates, there are a number of causes that contributed to collapse of the bridge. One of the best known causes for the bridge’s collapse is the wind. November 7th was a windy fall day and this was the first fall the bridge had experienced since construction was completed in the summer. On the day the bridge failed, the wind was blowing across the roadbed at 42 mph, the strongest wind the bridge had experienced. Another cause was the design of the bridge. The Tacoma Narrows Bridge was particularly narrow relative to its length, making the roadbed more flexible than other suspension bridges. Additionally, the bridge had shallow girders and was relatively weak in torsion compared to other suspension bridges built around the same time. The overall design of the bridge resulted in a structure that was weak in torsion and moved relatively easily in the strong wind.
As the wind impacted the bridge, the force twisted the roadbed until it hit a point where it was constrained by the suspender cables, and then it twisted back in the other direction. The motion of the bridge continued to grow until the twisting motion increased to the point where the suspender cables snapped and the roadbed was dropped into the river below. The mathematical explanation of why the bridge collapsed is fairly complex, but simply put: the bridge design was under damped causing the twisting oscillations to increase rather than decrease with each twisting cycle.
In addition to the mechanical causes that contributed to the failure, there were a number of issues with the design process that produced the bridge design. One of the primary drivers behind the bridge design was cost reduction. The first design proposed for the Tacoma Narrows Bridge was a conventional suspension bridge that was estimated to cost $11 million. The estimated price of the approved design was of $3 million dollars cheaper. Additionally, the approved design was considered to be much more elegant and aesthetically pleasing. As in the case of all designs that fail, the design review process was also ineffective or the design flaws that contributed to the bridge collapse would have been identified prior to construction.
Step 3. Select the Best Solution (Reduce the Risk)
The collapse of the Tacoma Narrows Bridge at a high level has only one cause. At a more detailed level it has 4 causes, 11 causes or even 100 causes. All of the levels of the Cause Map are accurate, some simply have more detail that others. This is analogous to zooming in and zooming out to reveal more or less detail. An issue should be worked to a sufficient level of detail to prevent the incident; meaning to reduce the risk of the incident occurring to an acceptable level. This is why solutions and work processes at a coffee shop are not as thorough or detailed as an airline or nuclear power facility. The risk or impact to the goals dictates how effective the solutions should be. Lower risk incidents will have relatively lower detail investigations while significantly high risk to an organization’s goals requires a much more through analysis. Possible solutions are typically documented on the Cause Map as a green box above the cause it addresses. When proposing the possible solutions don’t be concerned about limits, boundaries, schedules or financial constraints. Add all possible solutions to the Cause Map so everybody can see them and think about them. The best solutions are selected from the possible solutions and an action plan with owners and due dates is defined.
Below are a few causes from the Tacoma Narrows Bridge example with possible solutions.
The solutions above are two of the possible solutions that were incorporated into the design of the replacement Tacoma Narrows bridge that opened on October 14, 1950. The force of the wind hitting the bridge was reduced by using open trusses, rather than the solid stiffening girders used in the first bridge, resulting in less force on the bridge from the wind because the wind acted on a smaller area. The bridge was stronger because it had a wider roadbed and had larger stiffening struts. The replacement bridge has had no problems with oscillations and is still in use today.
The lessons learned from Tacoma Narrows have impacted modern suspension bridge design throughout the world. One example of design changes that resulted from lessons learned on the Tacoma Narrows bridge are the changes made to New York City’s similarly slim Whitestone Bridge in 1943. The roadbed of the Whitestone Bridge was strengthened by adding additional trusses and additional stays to reduce oscillations. The Whitestone Bridge has had additional modification over the years, but it remains in use today.
Cause Mapping Improves Problem Solving Skills
The Cause Mapping method focuses on the basics of the cause-and-effect principle so that it can be applied consistently to day-to-day issues as well as catastrophic, high risk issues. The steps of Cause Mapping are the same, but the level of detail is different. Focusing on the basics of the cause-and-effect principle make the Cause Mapping approach to root cause analysis a simple and effective method for investigating safety, environmental, compliance, customer, production, equipment or service issues.
Resources
The pictures used were copied from: Wikipedia’s Tacoma Narrows Bridge entry. (A videotape showing the collapse of the bridge may also be viewed on the Wikipedia website.)
Information used for the write up is from:
Washington State Department of Transportation
Wikipedia
a b Billah, K.; R. Scanlan (1991). “Resonance, Tacoma Narrows Bridge Failure, and Undergraduate Physics Textbooks”. American Journal of Physics 59 (2): 118–124. doi:10.1119/1.16590. Available online at http://www.ketchum.org/billah/Billah-Scanlan.pdf