
Cause Map Overview
People love their pets. If you’ve ever seen a dog or cat owner frolicking through the front yard or rolling around on the living room carpet, you’ve seen the affinity people have for their own personal roommate of friendly species. According to a 2009 CBS News article entitled “Do You Like Pets Better Than People?”, nearly two-thirds (63 percent) of American households have a pet.
Pet lovers spent $38.5 billion on their pets in 2006, up from $21 billion a decade earlier.
According to the Census Bureau, in the last decade, the percentage of homes with pets has remained relatively stable, but the amount of money people spend on pets has doubled.
We spend several billion dollars more on dog and cat food than on baby food. According to Bob Vetere, the president of the American Pet Products Manufacturers Association, 42 percent of pets sleep in the same bed as their owners – up from 34 percent in 1998. I found no statistic saying what percentage of people share their beds with other humans, but it’s obvious that pets are catching up.
These statistics are startling to some and unsurprising to others. So you can imagine the uproar, panic, fear and anger it might cause when pets are endangered. And you can imagine how pet owners must respond when their own pets are endangered.
Pet Food Contamination
In 2009, the American Pet Product Association conducted a study suggesting that Americans spent $45.4 billion on pets, broken into the following amounts:
- Food: $17.4 billion
- Supplies/OTC Medicine: $10.2 billion
- Vet Care: $12.2 billion
- Live animal purchases: $ 2.2 billion
- Pet Services: grooming & boarding: $ 3.4 billion
In other words, 38% of all money spent on pets in the US went to food.
And that sets the stage for the Pet Food Contamination Incident of 2007.
Cause Mapping Step #1: Define the Problem
Defining the Problem of Pet Food Contamination
Cause Mapping any incident, including pet food contamination, requires first asking four questions:
What is the problem?
If you asked a room full of people to answer this question, your chorus of answers might sound something like this:
“It seems obvious: the contaminated pet food was the problem.”
“Actually, it was that somehow the food got into the overall supply. If the food was contaminated but never got into the supply, this never would have happened.”
“I think the problem is dying pets. That seems like the humane thing to focus on.”
And our Cause Mapping professionals write all of these ideas down without judgment, then analyze them later in the Cause Mapping exercise.
When did it happen?
Cause Mapping requires pinpointing a date to see if something changed. It’s the “starting point” of the incident. The pet food contamination issue started March 15, 2007, when the Food and Drug Administration (FDA) was notified that animals were dying from consuming pet food from a pet food manufacturer who had switched to a Chinese supplier of wheat gluten.
Given the correlation (and subsequent research), we capture this as a difference.
Where did it happen?
Pets were affected worldwide.
How did it impact the goals?
Pet food contamination significantly affected two goals: Safety and Customer Service. Food manufacturers aim for zero injuries. Some veterinarians suggest that pet food contamination killed up to 1,000 dogs and cats in the U.S.
As for customer service, 150 brands— including Menu Foods pet food, the most affected brand, with 60 million containers) were recalled. This was the largest recall in FDA history and was estimated to have cost Menu Foods $54 million.
Other goals affected were Production and Materials/Labor. However, the magnitude of the loss of life makes any other impacts to the goals less significant.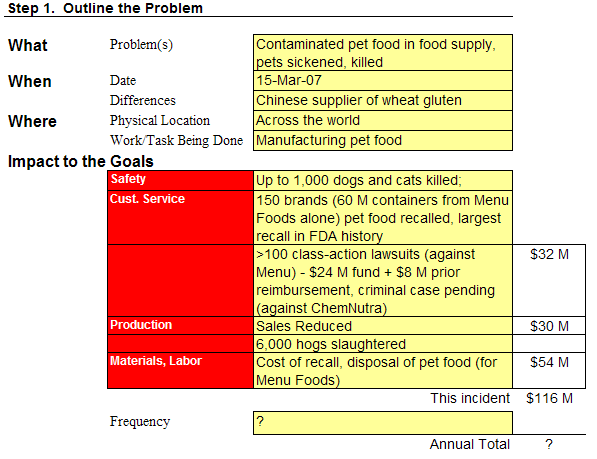
Cause Mapping Step #2: Identify the Causes
The Route the Contaminated Food Took to the Dog Dish
For any Cause Map, writing down goals is a key starting point. From there, the key is to ask why something happened and we can trace the incident’s causes.
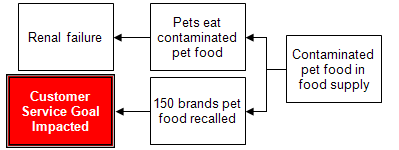
By starting with the safety goal, we get right to the heart of the matter as it relates to pet owners: up to 1,000 dead pets. By listing the customer service goal, we see that the most immediate impact is a result of the recall of 150 pet food brands:
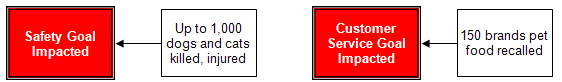
The deaths of the animals were caused by renal (kidney) failure:
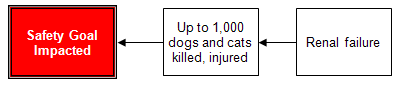
Cause Mapping also shows a common bond several steps prior. The renal failure took place from the consumption of the contaminated pet food. And both the consumption of the contaminated pet food and the recall itself take place because the contaminated pet food got into the supply in the first place.
The contaminated food entered the supply not only because melamine and cyanuric acid (CA) made it into the pet food, but also that it went undetected.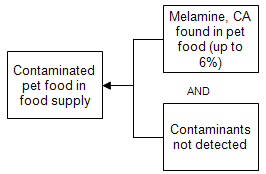
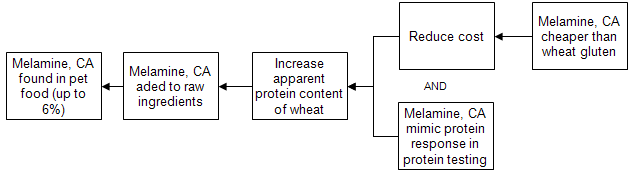
A good detective would ask, “Why were the melamine and CA added to the pet food in the first place?” As it turns out, the contaminants were added for the purpose of increasing the apparent protein content of the wheat. This was motivated by an overall effort to reduce cost and encouraging results from tests of the melamine and CA’s ability to mimic protein response in protein testing. Of course, had Melamine and CA not been cheaper than gluten, the traditional ingredient, they would not have been used.
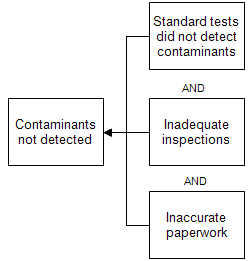
As shown above, though, the contaminants had to not only wind up in the food but also escape detection. To evade detection, the inspection process had to have broken down. Our Cause Map™ diagram shows three contributing factors to this:
- The standard inspection process lacked the rigor necessary to detect the contaminants,
- The inspections themselves were inadequate and did not match standard inspection requirements, and
- The paperwork was inaccurate and therefore failed to warn of potential issues.
These three issues can be traced backward, using the same inquisitive “Why” focused questioning that has built the rest of the Cause Map. We can see these incidents breaking out into multiple causes.
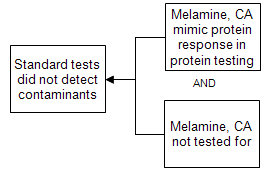
The issues with standard tests were somewhat similar to the reasons the manufacturer chose to use melamine and CA in the first place: They do a good mimicking protein response. Also, there are no standards for these contaminants and were therefore not tested.
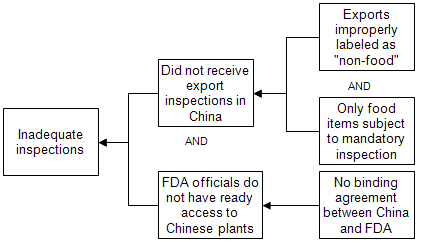
The inadequacy of the inspections themselves was due to two causes. One is that importers received no Chinese export inspections from China. The other is that the FDA doesn’t have access to Chinese plants.
Each of these individual causes can be broken out in the Cause Map in a helpful manner as well. No export inspections were received from China because the items were labeled as “non-food” and only “food” items are subject to mandatory inspection. The FDA’s restricted access was due to the lack of a binding agreement between China and the FDA.
Finally, the paperwork inaccuracy was due to certification from the broker that the shipment met the material specifications, and material specifications forbid foreign material.
Cause Mapping Step #3: Choosing Solutions
Solving the 2007 Pet Food Contamination
Cause Mapping the pet food contamination issue helps identify solutions and assess which ones are easiest to implement. The Cause Map leads to a better solution cache by identifying the full chain of events rather than oversimplifying the issue by reducing it to “the pets were killed because the manufacturer was trying to reduce costs.”
Why add detail?
There are multiple causes to every issue— and the pet food contamination tragedy is no different. The Cause Map demonstrates that, at a high-level analysis, there were only two causes. At a more detailed level, we can see 7 causes, 19 causes and 56 causes. All of the levels of the Cause Map are accurate; some simply have more detail than others. In this incident, adding detail was the right decision because it added potential solutions.
The detail in a given map should be worked to a point where risk can be reduced to an acceptable level. This is where debate between decision makers becomes constructive. The pet food contamination Cause Map demands detail because it was the largest recall in US history and led to the deaths of up to 1,000 deaths. This stands in contrast to, as an example, spilling a cup of water. For most people (save those with furniture that can be ruined by water), having a little bit of moisture on the ground is acceptable, as long as no one slips on it… but that’s an incident for a different map.
Altogether, the Pet Food Contamination Cause Map below details 69 causes, evidence and solutions.
Click here to download a PDF of the Cause Map.
How to Prevent Pet Food Contamination: Several Key Solutions
With a solid, creative Cause Mapping facilitation, the organizations involved could collect an incredibly high number of potential solutions. Here are just a few of those solutions.
Solution #1: Flush the Insoluble Crystals from the Kidneys
Renal failure is a cause very close to the end of the cause-and-effect relationship chain. The crystals formed from the melamine and CA are not soluble. Flushing the crystals out, once their presence is known, is one possible way to prevent the issue.
Solution #2: Use Alternative to Wheat Gluten as Filler
Wheat gluten was the replaced substance. Had wheat gluten not been the initial filler, melamine and CA may not have been the attempted replacement.
Solution #3: Change FDA Tests to Include Melamine and CA
This is a simple solution from an operational perspective. Had the tests looked for these substances, the issue would have been prevented. Plain and simple.
Solution #4: Alternate Method for Testing Protein (Not Nitrogen)
Testing nitrogen levels is the normal way of testing for protein because protein is the only source of nitrogen in food. However, an alternate test might have helped because the melamine and CA would not have mimicked protein in a way that fooled inspection.
Solution #5: Inspect Non-Food Exports
Had the Chinese government inspected the non-food exports, it would have caught the pet food in an inspection process rather than simply giving it a pass. While pet food isn’t animal food, the ingestion leads to the goal impacts discussed, so this is a viable option.
Solution #6: Using an Alternate Filler to Counteract a Short Supply of Wheat Gluten
When wheat gluten became scarce, the manufacturer had to hunt more. Using an alternative would have prevented it in the first place.
Solution #7: Create a Binding Agreement Between China and the FDA
A binding agreement would give the FDA access to the food before entering the country, thus presenting another potential stopping point.
Solution #8: Add FDA Staff in China
By having onsite FDA staff, the product may have never made it to the pets with contamination.
Pet Food Contamination Aftermath
Pet food contamination may have caused some of the residual effects that may come from the problem. In 2007, the FDA had to test human food to ensure pet food contamination hadn’t affected it. One 2008 study suggested “a possible link between the pet food contamination that occurred in North America in 2007 and the recent adulteration of milk protein and resultant intoxication of thousands of babies from Asia.“ And in 2011, the FDA issued a strong statement warning about the potential dangers of chicken jerky dog treats from China.