Summary:
On the morning of August 27, 2006, a Comair flight scheduled to travel to Atlanta International Airport attempted to take off from the wrong runway. The runway used was too short and the flight crashed near the end of the runway. There 49 people were killed and the single survivor was seriously injured. The plane was destroyed by impact forces and fire.
The Cause Mapping Method
Analysis of this accident can be used as an example of how the Cause Mapping method can be applied to a specific incident. The three steps in the Cause Mapping method are 1) Define the problem, 2) Conduct the analysis and 3) Identify the best solutions. Each step will be discussed below.
Step 1. Define the Problem
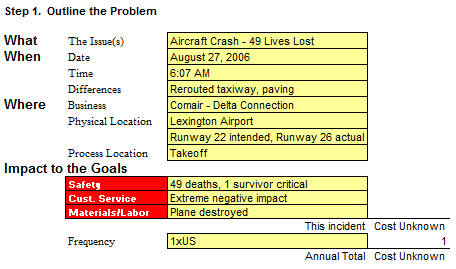
The first step of the Cause Mapping approach is to define the problem by asking four questions: What is the problem? When did it happen? Where did it happen? And how did it impact the goals? The answers to these questions are documented in an Outline. When asked “What is the problem?” people may give different answers. In this example, people would probably say the flight crashed or people were killed. There is no need to debate which is the right answer because all the answers are relevant. Write down all the different answers to the question on the first line of the Outline so the investigation can continue without wasting time debating.
In answering the second question “When did this problem happen?” the date and time of the incident should be documented as well as any differences that were present. The question of what is different is fundamental to any investigation and can provide clues as to why the failures occurred. In this example, the date is August 27, 2006 and the time is 6:07 am. The most significant difference was that the route to the runway had been changed for construction.
In an investigation there can be several pieces of information that need to be captured when specifying the location. At a minimum the physical/geographic location and the process location should be captured. For this example, the physical/geographic location of the accident is the Lexington Airport. The process location would be take-off. In some cases, there may also be a business location, where the name of the company and the business is listed; in this example it’s a commercial airplane operated by Comair. The Outline can be modified as needed to document any relevant location information.
The final question is to define the impact to the overall goals. The overall goals reflect the ideal state of an organization. The list of overall goals can be modified to be representative of the goals of any company, but the goals should represent the goals of the whole company and shouldn’t change for each division within a company. This section should be used to record potential impacts to the goal in addition to actual impacts to the goals.
In this example, there were 49 fatalities and one person was seriously injured. This would be listed under the Safety goal. The plane was destroyed, which would be listed under the Materials/Labor goal. Additionally, there was an extremely negative impact on the public opinion of the airline, which would be listed under the Customer Service goal.
The final piece of information documented on the Outline is the frequency of the incident. This indicates how often this has occurred or is likely to occur. The frequency is a multiplier that helps us to understand the total magnitude of an issue. In this case, this was the only accident of this type known in the US at the time.
When an investigation is started all the information needed to complete the Outline may not be available. Start by filling in all known information and then add to the Outline as information becomes known.
Below is a completed Outline for the Lexington plane crash example.

Step 2. Conduct the analysis
During the analysis step, the main question asked is “Why did this happen?”. To answer the question, the incident is broken down into causes which are captured on the Cause Map. To begin creating a Cause Map, start by writing down one of the goals that was impacted. When the Cause Map is completed, all the goals with their associated causes will be listed on the Cause Map, but it is usually simplest to start building the Cause Map with a single goal. The goal is listed in a red box and the first cause will be the impact to the goal that was listed on the Outline. A Cause Map can be read left to right by putting the words “was caused by” between the boxes.
For this example, the Safety goal was selected to begin building the Cause Map. This is what the first cause-and-effect relationship would look like.

The next cause on the Cause Map is added by asking “why” the fatalities occurred. Keep asking “why” questions and adding boxes to the right. This is what the Cause Map could look like after asking four more “why” questions.

While the above Cause Map is accurate, it is a simplified analysis. Detail can be added to the Cause Map in a number of ways. The Cause Map can continue to be built left to right by asking why questions and adding causes. Causes can be added in between existing Causes by taking smaller steps when asking why questions. Causes can also be added vertically. Many effects require more than one cause to happen. To determine if additional causes should be added vertically, ask “Is this cause sufficient (on its own) to produce the effect?” If the answer is no, more causes should be added. To check if a cause is documented appropriately, ask “Is the cause necessary to produce the effect?” If the answer is yes, the cause is documented correctly. If the answer is no, the cause should not be included.
Below is the Lexington plane crash Cause Map with additional detail added. Additional causes have been added to the right of the Cause Map, including two causes that build vertically and are separated by an “and”. In this example, the plane used the wrong runway because it turned onto the wrong runway because pilots thought they were turning onto the correct runway AND the controller didn’t stop them from turning onto the incorrect runway. Both causes are needed for the plane to turn onto the wrong runway. Additional detail has been added between the cause “plane crashed” and “runway too short”. The additional causes help explain why a short runway caused the plane to crash. The plane wasn’t able to achieve the necessary velocity so the lift was insufficient and the plane crashed during the attempted take-off.

As much detail as needed can be incorporated by continuing to add causes. As with any investigation the level of detail in the analysis is based on the impact of the incident on the organization’s overall goals. The greater the impact to the goals, the more detailed the Cause Map will be. In a case like this example where there are fatalities, the level of detail should be relatively high.
Additionally, each impacted goal should be added to the cause map. Using the same method as before, each impacted goal should be listed in a red box and added to the Cause Map by asking “why” questions. This should continue until the point where each impacted goal connects to a cause already documented on the initial Cause Map. The causes for each impacted goal should lead back to a cause already listed on the main Cause Map; otherwise, the impact to the goals may have occurred from two separate incidents and the Outline should be revisited.
Below is the Lexington plane crash Cause Map with all impacted goals added to the analysis.

Continue to ask “why” questions and build the Cause Map until the level of detail is sufficient to understand the issue.
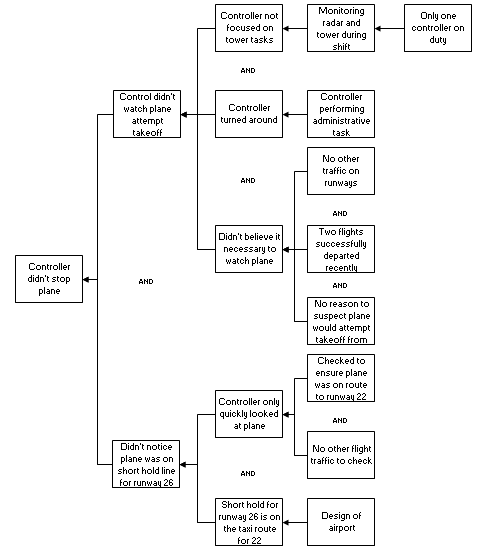
In this example, more causes need to be added to the right of the Cause Map to explain why the controller didn’t stop the plane from attempting to use the wrong runway.
Let’s look at the controller branch first.

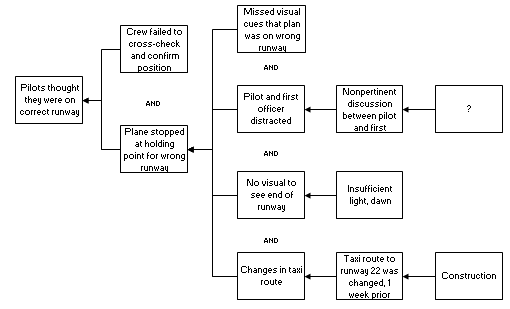
Now consider the causes for why the pilots thought they were on the correct runway.
This version of the Cause Map has significantly more detail than the first maps with only two to five boxes.
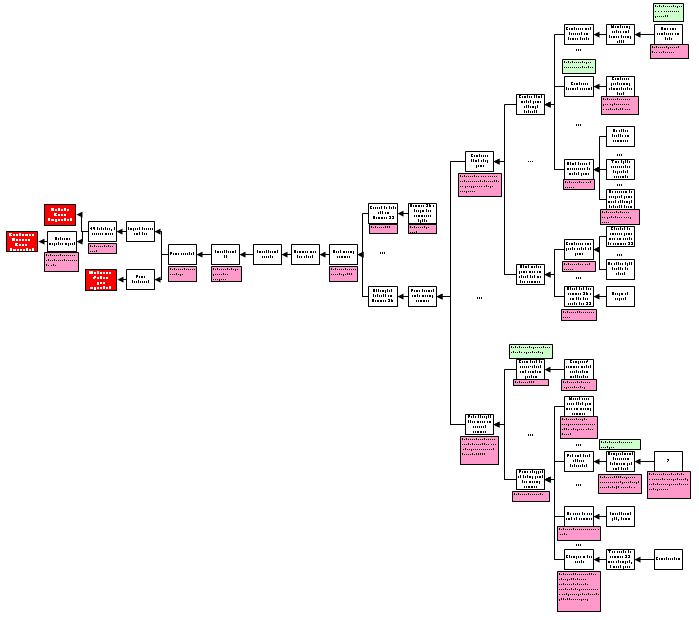
To help document and visualize the analysis, evidence should be documented directly on the Cause Map. The typical way to do this is to state the evidence in a pink box under the cause the evidence supports. There can be many sources of evidence. Evidence may be a statement or testimony, diagram, historical trend, experiment or test, etc. Any piece of information that furnishes proof of a cause can be documented on the Cause Map.
During an investigation, additional evidence may disprove a particular cause. When this happens, the evidence that disproves the cause is placed below the cause and the cause is crossed out, but not removed from the Cause Map. This helps document causes that were considered, but ultimately determined not to be related to the incident. Evidence that disproves the cause should also be included.
Once the Cause Map is built to a sufficient level of detail with supporting evidence, it can be used to develop solutions. The Cause Map is used to identify all the possible solutions for a given issue so that the best solutions can be selected. It is easier to identify many possible solutions when there are many causes incorporated on a detailed Cause Map than from the oversimplified high level analysis.
This is an intermediate level Cause Map of the loss of the Lexington plane crash Cause Map. This example shows what the Cause Map looks like with 43 causes, evidence blocks and some possible solutions added.

Why did the Lexington Plane Crash Happen?
Plane crashes are unique in the fact that there is a lot of data available to investigators. The cockpit voice recorder (CVR) records all conversations in the cockpit and the flight data recorder (FDR) records instrument readings. The Cause Map can be built to a very high level of detail, if warranted. Now that the analysis is completed, the causes of the Lexington air plane crash can determined.
As the Cause Map demonstrates, there are a number of causes that contributed to the accident. This accident is an interesting example because even after a thorough investigation by the National Safety Transportation Board (NSTB), it couldn’t be determined exactly why the pilots attempted to take off using the wrong runway. The NSTB determined that one of the significant causes was the failure to cross check and confirm position prior to attempting the take-off, but this doesn’t provide a lot of insight into why the original mistake was made.
Even in a case like this, building a Cause Map is still a useful exercise that provides a lot of information. The Cause Map shows that there were a number of causes that contributed to the runway mistake, even if it isn’t clear exactly why the confusion occurred. The actions of the air traffic controller played a very important role in the accident because if the controller had noticed the pilots were positioned at the wrong runway and informed the pilots, the accident never would have occurred.
There are a couple of important facts to consider when trying to understand the runway mistake. First, both runways were properly marked according to FAA regulations and the pilots knew which runway they were assigned to use. However, the runway used wasn’t marked in a manner consistent with a commercial runway. For example, there were no precision runway markings or edge lighting.
The geography of the airport is also relevant. The short hold line (the position where planes stop before takeoff) for the runway used, runway 26, was on the route to the correct runway, runway 22. This means that to reach the correct runway, the plane had to pass over the short hold line for the incorrect runway. This runway layout certainly contributed to the pilot’s confusion.
There is clear evidence from the data on the CVR that the pilot and co-pilot were having a non-pertinent discussion during a critical part of the taxi, which may have contributed to their loss of bearings. It was also early in the morning. The investigation determined that the pilots had adequate rest prior to the accident, but they may not have been as alert as they would have been later in the day and that their vision was impaired so they couldn’t see to the end of the runway.
The taxi route to the runway had recently been changed because of construction. Early media reports on the accident assumed that the changes in the taxi route contributed to the accident, but the Nation Safety and Transportation Board determined that the taxi route changes weren’t an issue for a number of reasons. First off, neither pilot nor copilot was very familiar with the previous taxi route so the changes shouldn’t have been confusing. The new route was properly marked. Additionally, other planes had successful navigated the changed taxi route with no difficulties.
As the Cause Map shows, even allowing for the runway confusion, the accident would not have occurred if the air traffic controller had noticed the error and stopped the plane prior to the take-off attempt. There was only one air traffic controller on duty, which meant that he had to split his time between monitoring traffic and checking radar. At the time of attempted takeoff, the controller was performing an administrative task and wasn’t watching the airplane. In interviews with the controller, he stated that he didn’t think watching the plane was necessary because it was the only plane on the runways at the time and there was no history of attempted take-offs on the wrong runway.
The Cause Map helps determine what causes had to be present for this accident to happen. In this example, the pilots had to confuse runways and the controller had to miss the mistake.
Step 3. Select the Best Solution (Reduce the Risk)
The Lexington plane crash has only one cause at a high level. At a more detailed level it has 5 causes, 11 causes or even 100 causes. All of the levels of the Cause Map are accurate, some simply have more detail than others. This is analogous to zooming in and zooming out to reveal more or less detail. An issue should be worked to a sufficient level of detail to prevent the incident; meaning to reduce the risk of the incident occurring to an acceptable level. This is why solutions and work processes at a coffee shop are not as thorough or detailed as an airline or nuclear power facility. The risk or impact to the goals dictates how effective the solutions should be. Lower risk incidents will have relatively lower detail investigations while a significantly high risk to an organization’s goals requires a much more thorough analysis.
Possible solutions are typically documented on the Cause Map as a green box above the causes they address. When proposing possible solutions don’t be concerned about limits, boundaries, schedules or financial constraints. Add all possible solutions to the Cause Map so everybody can see them and think about them. The best solutions are selected from the possible solutions and an action plan with owners and due dates is defined.
Cause Mapping Improves Problem Solving Skills
The Cause Mapping method focuses on the basics of the cause-and-effect principle so that it can be applied consistently to day-to-day issues as well as catastrophic, high risk issues. The steps of Cause Mapping are the same, but the level of detail is different. Focusing on the basics of the cause-and-effect principle make the Cause Mapping approach to root cause analysis a simple and effective method for investigating safety, environmental, compliance, customer, production, equipment or service issues.
Resources
The images used were produced by the NTSB.
Information used for the write up is from NTSB Accident Report NTSB/AAR-07/05, PB2007-910406. It can be downloaded free from http://ntsb.gov/.
Bring Cause Mapping® Root Cause Analysis training to your site
Schedule a workshop at your location to train your team on how to lead, facilitate, and participate in a root cause analysis investigation.
