This is an example of how the Cause Mapping process can be applied to a specific incident. In this case the explosion at the Formosa facility in Point Comfort, Texas is captured as an example of the Cause Mapping method. The three steps are 1) Define the problem, 2) Conduct the analysis and 3) Identify the best solutions. Each step will be discussed below.
Step 1. Define the Problem
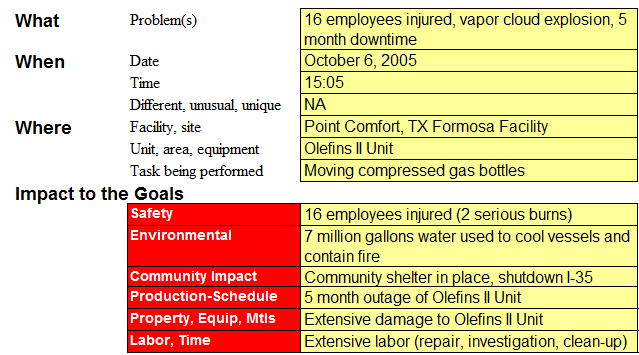
The first step of the Cause Mapping approach is to define the problem by asking the four questions: What is the problem? When did it happen? Where did it happen? And how did it impact the goals? In this case, the safety goal was impacted due to 16 injuries, 2 of which were serious burns. The environmental goal was impacted due to the 7 million gallons of water used to contain the fire. Additionally, the evacuation of the local elementary school and I-35 shutdown were impacts to the community goal. The significant damage to the facility and resulting downtime impacted the production, property and labor goals.
Step 2. Identify the Causes (The Analysis)
The analysis step is where the incident is broken down into causes which are captured on the Cause Map. The Cause Map starts by writing down the goals that were affected as defined in the problem outline. For the fire at the Formosa Point Comfort facility, the safety goal was impacted because of the 16 injuries and 2 serious burns. This is the first cause-and-effect relationship in the analysis.

The analysis can continue by asking Why questions and moving to the right of either of the cause-and-effect relationships above. In this example we’ll start with the 16 injuries which were caused by the explosion and initial fire.

We continue to ask “Why” questions to develop the Cause Map. The explosion and initial fire were due to a large, propylene vapor cloud.

Any fire requires heat, fuel and oxygen.
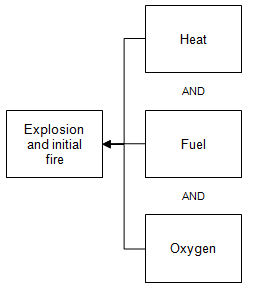
In this case, the heat source was not conclusively identified, although there was vehicular traffic in the area.
Oxygen, sufficient for burning, is present in the atmosphere.
The fuel for the fire was the large propylene vapor cloud. The source of the propylene was a broken nipple on a liquid propylene process line that had been hit by a fork truck moving compressed gas cylinders.
The nipple was on a live, 300 psig liquid propylene line that was located on the edge of an access way. The access way had not been designed for traffic, but was used for traffic because it was large enough and not blocked. There was no protective barrier located in front of the nipple and piping to protect the equipment from accidental damage.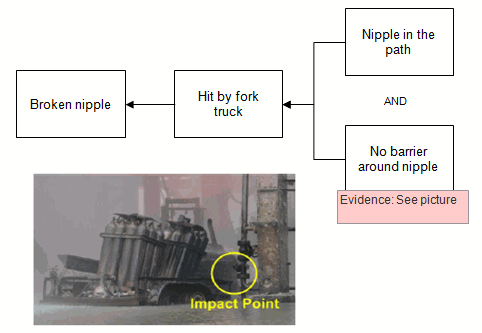
In addition to the broken nipple, the large propylene vapor cloud resulted from the inability to remotely shut off the propylene flow. The manual valves could not be accessed by the operators in the field due to the vapor cloud.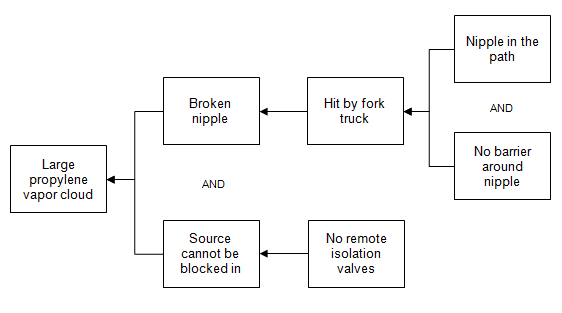
In addition to the fire, the employees were injured due to ineffective personal protective equipment. The employees were not wearing fire retardant clothing because it was not required for the Olefins II process unit.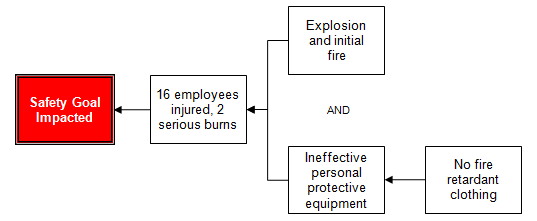
The significant property damage and resulting downtime was a result of a large fire. The large fire was a result of the explosion and initial fire and an additional, uncontrolled fuel source.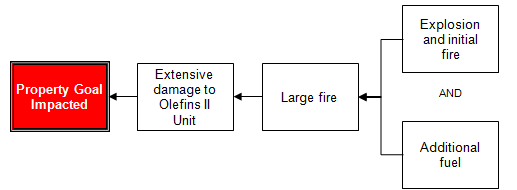
The additional fuel was a result of multiple pieces of equipment and process piping, including flare piping, that ruptured when the support structure failed. The support structure failed due to inadequate fire proofing. The design for fire proofing had been re-used from an earlier unit design and had not been updated to include current fire proofing standards.
Step 3. Select the Best Solutions (Reduce the Risk)
Once the Cause Map is built to a sufficient level of detail with supporting evidence, it can be used to develop solutions. The Cause Map is used to identify all the possible solutions for a given issue so that the best solutions can be selected. It is easier to identify many possible solutions from the detailed Cause Map than an oversimplified high level analysis.
Solutions can be documented directly on the Cause Map. Solutions are typically placed in a green box directly above the cause the solution controls. At this stage, all solutions are considered and put on the Cause Map.
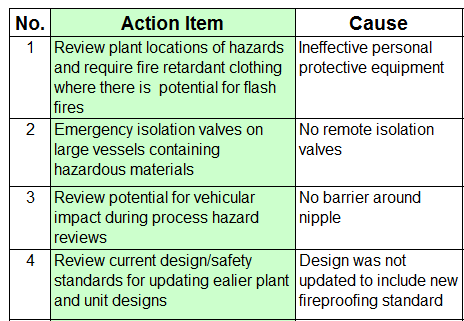
After the analysis is complete, the best solutions are selected based on the impacts to the organization’s goals. Shown below are the action items implemented as a result of this incident.
Cause Mapping Improves Problem Solving Skills
The Cause Mapping method focuses on the basics of the cause-and-effect principle so that it can be applied consistently to day-to-day issues as well as catastrophic, high risk issues. The steps of Cause Mapping are the same, but the level of detail is different. Focusing on the basics of the cause-and-effect principle make the Cause Mapping approach to root cause analysis a simple and effective method for investigating safety, environmental, compliance, customer, production, equipment or service issues.
Click on “Download PDF” above to download a PDF showing the Root Cause Analysis Investigation.
Learn more:
CSB Case Study
Bring Cause Mapping® Root Cause Analysis training to your site
Schedule a workshop at your location to train your team on how to lead, facilitate, and participate in a root cause analysis investigation.
