Cause Mapping Example:
The Deepwater Horizon oil rig was in the final stages of exploratory drilling at the Macondo well in the Gulf of Mexico when disaster struck. On April 20, 2010, the rig exploded, killing 11 workers and forcing the evacuation of the rig. It quickly became clear that the emergency measures taken prior to evacuation had not sealed the well and that great amounts of oil were leaking into the Gulf of Mexico.
Immediately, plans were developed to stop the oil leaking from the well while attempting to avoid anything that might cause the leak to expand. This delicate balancing act – and a host of other factors from a hurricane to political wrangling – meant that it would take nearly 3 months before the leak was stopped, and nearly 5 months before the well was declared effectively dead.
The months between the beginning and end of the leak were defined by contingency plan after contingency plan. We’ll examine this incident closer to look at what happens when your original solution doesn’t solve the problem.
We’ll use the Cause Mapping process to provide an analysis of the issues related to the Deepwater Horizon explosion and oil spill. The Cause Mapping method utilizes three steps: 1) Define the problem, 2) Conduct the analysis and 3) Identify the best solutions. Each step will be discussed below.
Step 1. Define the Problem
The first step of the Cause Mapping approach is to define the problem by asking the four questions: What is the problem? When did it happen? Where did it happen? And how did it impact the goals? One person may say that the problem was the well blowout. Another person might say that the problem was the explosion on the rig, and a third person could say that the problem was the worker fatalities. We can write down these three “problems” on the first line. In the Cause Mapping methodology the facilitator anticipates that the group may disagree so all three responses are written down. There is no need to spend time debating the problem. The magnitude of this incident is defined by the impact to the goals.
The second question is the “When?” which is the date and time of the incident. When captures the timing of the issue and also has a line for what was different or unusual in this occurrence. The question of what was different is fundamental in any investigation. On the Deepwater Horizon issue we capture the date as April 20, 2010 and the time of 9:49 PM when the first explosion occurred. An important difference was confusing test pressure results.
In an investigation there can be several pieces of information that need to be captured when specifying the location. At a minimum the physical/geographic location and the process should be captured. The physical location is where geographically the incident happened. In this case, the incident occurred in Macondo Prospect in the Gulf of Mexico on the Deepwater Horizon oil rig. At the time of the explosion, the rig was performing the final phase of drilling an exploratory well.
The next part of the outline captures the impact to the overall goals. According to the operator of Deepwater Horizon, “Our goals are simply stated. No accidents, no harm to people, and no damage to the environment.” Clearly the 11 fatalities and 17 injures are an impact to the safety goal. The ~4.9 million barrels (by government estimate) of oil spilled is an impact to the environmental goal. There were other goals that were affected but the magnitude of the loss of life makes any other goals less significant. The two impacted goals that we will use for our analysis are the safety goal and the environmental goal.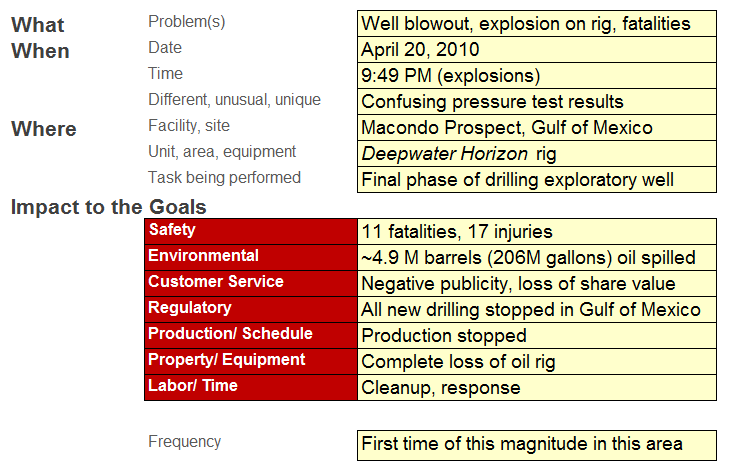
Step 2. Identify the Causes (The Analysis)
The analysis step is where the incident is broken down into causes which are captured on the Cause Map. The Cause Map starts by writing down the goals that were affected as defined in the problem outline. For Deepwater Horizon, the safety goal was impacted because of the1 1 lives that were lost and 17 injures. The environmental goal was impacted because of the spill. These are the first two cause-and-effect relationships in the analysis.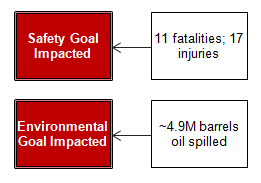
The analysis can continue by asking “Why” questions and moving to the right of either of the cause-and-effect relationships above. In this example we’ll examine the spill, which was caused by damage to the riser. Additionally, the magnitude of the spill directly resulted from (was caused by) the blowout preventer (BOP) not sealing the well, as designed, for reasons that are not entirely clear. Because both of these causes were necessary for the oil spill to occur, they are joined with “AND”.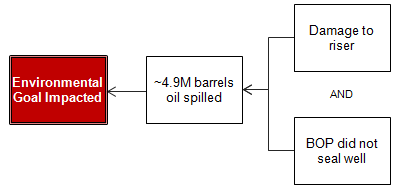
We can begin by providing more detail by asking more “Why” questions about the riser damage. The riser damage was caused by the explosion, which resulted from hydrocarbons flowing onto the platform (the fuel) and causing an engine overspeed (the ignition source).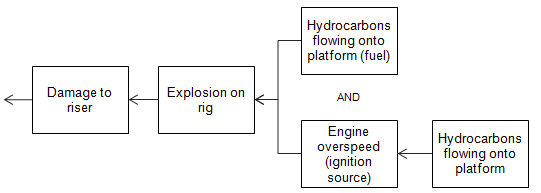
Hydrocarbons flowed onto the platform when they flowed up riser. The mud-gas separator (MGS) became overwhelmed when the crew vented to the MGS for unknown reasons. The MGS was not designed for large flow rates.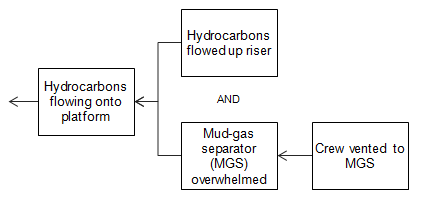
The uncontrolled flow up the riser (blowout) was caused by a failure of the well seat due to an ineffective cement job and failure of the barriers in the shoe track, which allowed the hydrocarbons to enter the production casing, for unknown reasons. Additionally, the crew did not recognize there was a problem until the blowout occurred. (A well control problem is known as a “kick”.) This is because the ambiguous pressure test results we talked about earlier were misinterpreted. The test guidelines did not clearly specify success and failure criteria.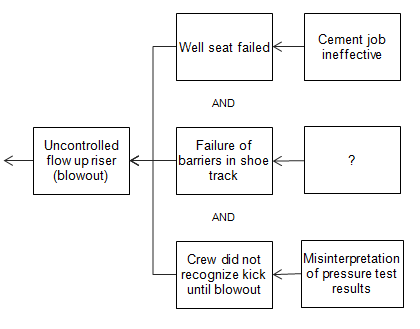
The amount of detail provided in an analysis must be adequate to determine effective solutions in reducing the impacts to the goals. In the case of Deepwater Horizon, the immediate solutions focused on stopping the oil flow out of the damaged riser. The rig itself capsized and sank, and will not be used again.
During the course of the internal investigation, eight key findings were identified. These eight key findings can be addressed in a Cause Map with a higher level of detail. To view a PDF showing the eight key findings, click here or on the button above.
Step 3. Select the Best Solutions (Reduce the Risk)
Once the Cause Map is built to a sufficient level
of detail with supporting evidence the solutions step can be started. The Cause Map is used to identify all the possible solutions for given issue so that the best solutions can be selected. The possible solutions can also provide backup plans in case the initial solutions selected didn’t work, as happened in this case.
Plan A: The first plan (action item) was to attempt to use functionality within the blowout preventer (BOP) which had failed to seal the well. A remote-operated vehicle (keep in mind that all the equipment and functionality were either at the bottom of the Gulf of Mexico or on an evacuated oil rig spewing thousands of gallons of oil) would be used to activate the BOP’s auto-shear mechanism, which should cut and block the pipe delivering oil from beneath the gulf to the surface. It didn’t work. Attempts to intervene with the BOP ended May 5th.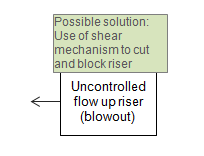
Plan B: Plan B involved the installation of a cofferdam, a dome that would be placed over the leak and divert the oil to a surface ship. The cofferdam reached the bottom of the Gulf May 7th, got clogged with hydrates (a byproduct of the process) and couldn’t be forced down over the leak.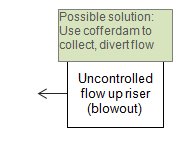
Plan C: The next plan was to use a Riser Insertion Tube Tool (RITT) that would siphon some of the flow from the end of the riser and redirect it to a surface ship for collection. The RITT was partially successful. It did divert some of the flow from the leak. But not all. More solutions were still needed.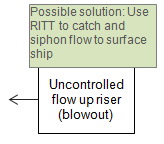
Plan D: The next plan aimed to end the flow from Macondo well by ramming heavy mud and cement directly into the well itself. This was known as a “top kill”. The top kill began on May 26th. Three days later, the operation was stopped when it became clear the top kill was no match for the flow from the well.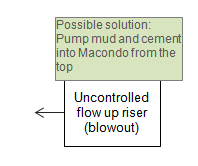
Plan E: The plan designed to capture ALL the flow was a 3-ram capping stack, or “sealing cap”. This cap was designed to seal tightly, capture all the oil and divert it to two surface ships. Also at the ready were other caps in case the capping stack couldn’t be seated properly. The cap was finally placed on July 12th and the flow was choked on July 15th. Now the flow was controlled, but the Macondo well was still releasing oil at a high rate.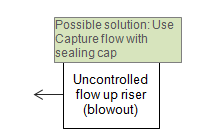
Plan F: I’m calling this plan F because it was what finally ended the issue after attempts at Plans A-E. However, Plan F had been a long time in coming. This involved the drilling of relief wells. The first relief well had begun May 2nd. The relief wells were dug in with the plans of intercepting and pumping mud, then cement, down into the Macondo reservoir, a permanent fix to the spill (known as a “static kill”). This, like all the other tasks involved with shutting down the Deepwater Horizon leak, as not an easy task. The static kill was completed on August 4th. That still wasn’t the end. The last cement was placed on September 18th and it was announced that the well was ‘effectively dead’.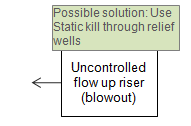
Response, recovery and investigation into the Deepwater Horizon incident continues. Some of the specifics may never be known as the evidence required is lost with the rig and the workers who were killed. The reminders of the tragedy will remain, and hopefully the lessons learned will be applied to other incidents to ensure that safety is maximized in difficult environments in the future.
Click on “Download PDF” above to download a PDF showing the Root Cause Analysis Investigation.
Resources
The information used to make this Cause Map was obtained from:
A Hole at the Bottom of the Sea: The Race to Kill the BP Oil Gusher by Joel Achenbach
Internal Accident investigation Report
CSB Investigation on the Macondo Blowout and Explosion
Deepwater Horizon Study Group’s Final Report on the Investigation of the Macondo Well Blowout
Bring Cause Mapping® Root Cause Analysis training to your site
Schedule a workshop at your location to train your team on how to lead, facilitate, and participate in a root cause analysis investigation.
