
This is an example of how the Cause Mapping process can be applied to a specific incident. In this case the devastation in New Orleans due to Hurricane Katrina is captured as an example of the Cause Mapping method. The three steps in the Cause Mapping method are 1) Define the problem, 2) Conduct the analysis and 3) Identify the best solutions. Each step will be discussed below.
Step 1. Define the Problem
The first step of the Cause Mapping approach is to define the problem. First we ask four basic questions: What is the problem? When did it happen? Where did it happen? And how did it impact the goals?
The first step of the Cause Mapping approach is to define the problem by asking the four questions: What is the problem? When did it happen? Where did it happen? And how did it impact the goals? One person may say that the problem was Hurricane Katrina hit New Orleans. Another person might say that the problem was that the levee system failed and a third person could say that the problem was residents weren’t evacuated effectively. We can write down all these “problems” on the first line. In the Cause Mapping methodology the facilitator anticipates that the group may disagree so all three responses are written down. There is no need to spend time debating the problem. The magnitude of this incident is defined by the impact to the goals.
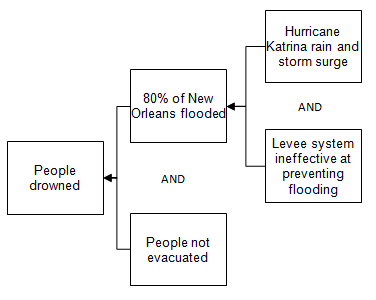
The second question is the “”When?”” which is the date and time (if applicable) of the incident. When captures the timing of the issue and also has a line for what was different or unusual in this occurrence. The question of what was different is fundamental in any investigation. On the Hurricane Katrina issue we capture the date as August 29, 2005 and the time is not captured, as there is not one specific minute or hour related to this incident. It was noted that segments of the protective system were incomplete when Katrina made landfall.
In an investigation there can be several pieces of information that need to be captured when specifying the location. At a minimum the physical/geographic location and the process should be captured. The physical location is where geographically the incident happened. The process is what task was being performed when the incident occurred.
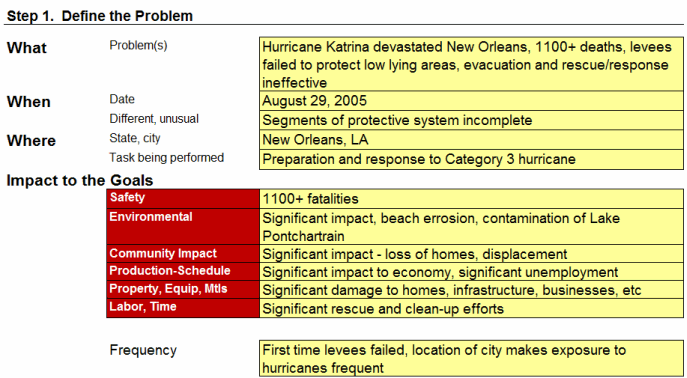
The next section is the impact to the overall goals. For any organization or locality, one of the overall goals is to have zero injuries. During Hurricane Katrina, there were over 1100 fatalities in New Orleans alone. One of the other goals is to have no damage to business or residential property. In the case of Hurricane Katrina, there was significant damage to homes, infrastructure and businesses. This direct damage has been estimated at ~$27 billion. There were other goals that were affected but the magnitude of the loss of life makes any other goals less significant. The goal that is highlighted in the Hurricane Katrina example is the safety goal.
Step 2. Identify the Causes (The Analysis)
The analysis step is where the incident is broken down into causes which are captured on the Cause Map. The Cause Map starts by writing down the goals that were affected as defined in problem outline. The analysis step is where the incident is broken down into causes which are captured on the Cause Map. The Cause Map starts by writing down the goals that were affected as defined in the problem outline. For Hurricane Katrina the safety goal was impacted because of the 1100+ lives that were lost. This is the first cause-and-effect relationship in the analysis.
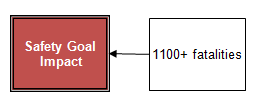
The analysis can continue by asking “Why” questions and moving to the right of the cause-and-effect relationship above. The loss of over 1100 lives which was caused by people drowning and people dying of dehydration, malnutrition and infection. Both of these causes beg us to ask the next question, “Why?”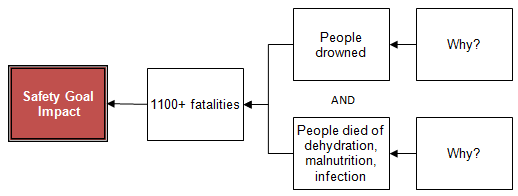
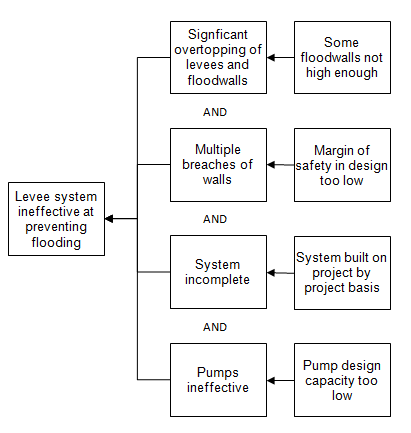
If we ask the question “Why did people drown?”, we can identify that 80% of New Orleans was flooded and people were not evacuated. 80% of New Orleans was flooded not only due to the storm surge and rain from Hurricane Katrina, but also because the levee system designed to protect the city from flooding was ineffective.
There were several reasons why the levee system was ineffective, including the fact that multiple walls were over-topped, multiple walls were breached, the system itself was not complete, and the pumps were ineffective. As they say, the devil is in the details, so if we continue to ask “why” for all these causes, we start to identify specific causes that we can start to apply solutions to.
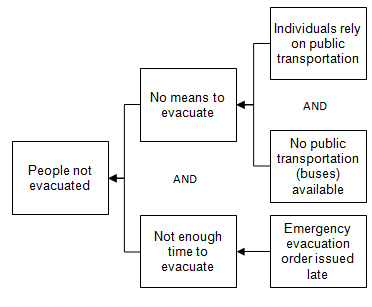
We can continue our analysis by asking “Why were some people not evacuated?” Some people did not have a means to evacuate. 100,000 city residents relied solely on public transportation and there was none available due to a lack of buses and licensed bus drivers. In addition, there was not enough time to evacuate due to the mandatory evacuation order coming too late. The mandatory evacuation order was given 19 hours prior to landfall, although the evacuation staging plan required 30 hours.
In addition to the drowning deaths, there were a number of people that died due to dehydration, malnutrition, and infection. These deaths were caused by the time it took to rescue these individuals and a lack of adequate food, water and medical supplies. This was certainly widely acknowledged and criticized on the news during and after the incident. The supplies on hand at the refuge of last resort, the SuperDome, were inadequate, as they planned to shelter 800 refugees but received 26,000.

Supplemental supplies were slow in coming because of an ineffective logistics and communication process, which was caused by lack of experience within FEMA. The head of FEMA had no emergency response experience, as he was a political appointee. In addition, key roles within the FEMA organization were inexperienced or vacant due to funding cuts to the organization. Post 9-11, FEMA became part of the newly formed Department of Homeland Security, which allocated resources based on terrorist threats.

Even more detail can be added to this Cause Map as the analysis continues. As with any investigation the level of detail in the analysis is based on the impact of the incident on the organization’s overall goals.
Step 3. Select the Best Solutions (Reduce the Risk)
Once the Cause Map is built to a sufficient level of detail with supporting evidence the solutions step can be started. The Cause Map is used to identify all the possible solutions for a given issue so that the best solutions can be selected. It is easier to identify many possible solutions from the detailed Cause Map than an oversimplified high level analysis. For example, a simple “”5-Why”” analysis of this incident leads us to a solution “”Don’t have hurricanes””. A number of possible solutions to prevent this, and similar incidents from occurring again, are listed on the Cause Map. They clearly identify which specific cause on the Cause Map each solution addresses.

Cause Mapping Improves Problem Solving Skills
The Cause Mapping method focuses on the basics of the cause-and-effect principle so that it can be applied consistently to day-to-day issues as well as catastrophic, high risk issues. The steps of Cause Mapping are the same, but the level of detail is different. Focusing on the basics of the cause-and-effect principle make the Cause Mapping approach to root cause analysis a simple and effective method for investigating safety, environmental, compliance, customer, production, equipment or service issues.