
The Challenger space shuttle made history repeatedly. Its maiden flight in April 1983 witnessed the first spacewalk during a space shuttle mission. Two months later, Sally Ride became the first American woman in space. Throughout its subsequent missions, the Challenger also carried the first African American, Canadian and Dutchman into space. Unfortunately, its 10th flight marked another first—NASA’s first space shuttle disaster. For this case study, we’re using the Cause Mapping® method of root cause analysis to better understand what happened on the ill-fated 10th flight and evaluate how the risk of a similar incident could be reduced.
An Exciting First Becomes Tragic on Live TV
The launch of the Challenger the morning of January 28, 1986, was a momentous occasion, even for a shuttle well versed in historic firsts. It was the first voyage of the new Teachers in Space Project—the first flight on which someone who was not a trained astronaut was permitted to travel into space. Chosen from more than 11,000 other candidates, Christa McAuliffe had planned to give lessons from space. Schools around the country tuned in for the liftoff. The program was an effort to get the public invested in the space program while signaling that space travel was becoming more normal and accessible. Accordingly, there were more media present on that morning with below-freezing temperatures in Cape Canaveral, Florida as millions of people around the world watched.
At the time, the Challenger was the most-flown orbiter in NASA’s fleet. But 73 seconds after liftoff, the space shuttle broke apart over the Atlantic Ocean, taking the lives of all seven crewmembers. For NASA, was a catastrophic event on several levels: seven colleagues lost their lives; a multimillion-dollar space shuttle was destroyed; and the good public relations NASA hoped to garner was ruined. (In fact, an estimated 85 percent of Americans heard about the disaster within the hour it happened.)
Step 1: Define the Problem with Four Questions
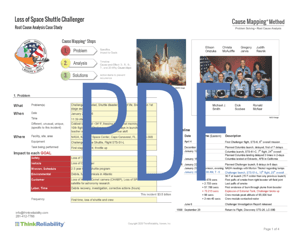
The first step in any root cause analysis approach is to define the problem. We do so by asking four critical questions:
What Is the Problem?
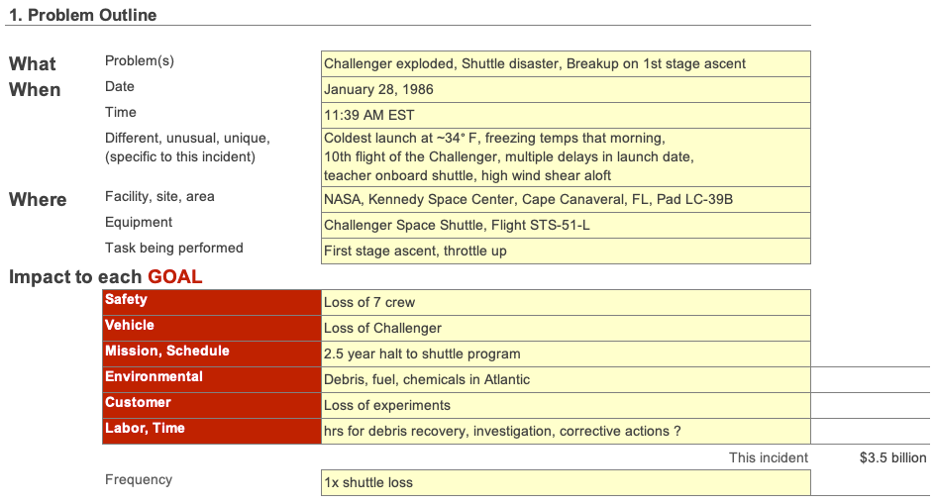
In investigating any incident, big or small, the process of specifying the problem is likely to elicit multiple responses. Avoid arguments and write down all of the potential problems for later evaluation. For this example, we identify the loss of all seven crewmembers and the loss of the space shuttle as the major problems.
When Did It Happen?
In order to measure change, specify as precise of a time as possible for the given incident. Here, the Challenger broke apart two minutes into its 10th mission, at 11:39:12 AM EST on January 28, 1986.
Where Did It Happen?
In addition to capturing a specific time, we also need to capture the specific location when defining the problem for the root cause analysis. While other Cause Map diagrams related to space disasters technically describe an incident that occurs in two locations (at the space shuttle and command center), the emphasis remains on the location that can be controlled: the command center. In this case, the space shuttle broke apart just after launch; the Challenger facility (STS 51-L) at Cape Canaveral is captured as the location for the incident.
How Did It Impact the Organization’s Goals?
All organizations have multiple goals in common. They want to ensure the safety of employees and the public, to remain within budget, to achieve the intended purpose of the organization, to avoid damaging equipment, and to do it all as efficiently as possible. These are goals that those within the organization can agree on. For this example, these elements are understood in terms of safety, vehicle, equipment, mission and labor goals.
Safety is clearly an important goal to NASA’s spaceflight missions: a manned mission isn’t considered a success unless all of the astronauts come back home. In this case, the safety goal was affected by the deaths of the seven astronauts aboard.
In addition, space flight is expensive. The Challenger was built to complete multiple missions (it had already completed nine), and its construction involved a gigantic investment in time and money. Losing the space shuttle meant losing billions of dollars of equipment, as well as the possibility of reusing the shuttle in other missions. Since the shuttle disintegrated, the mission was a complete loss in terms of the impact to the goals regarding the vehicle.
As a result of the disaster, the solid rocket booster joints had to be redesigned, impacting the equipment goal.
Finally, investigation and testing in the wake of the disaster affected the labor goal since the space shuttle program suspended all flights for 32 months.
Within the Cause Mapping investigation template, these four questions are captured together on the “1. Problem” worksheet. For this issue, the problem outline looks like this:
Step 2: Analyze the Problem
Once we outline the problem, using evidence collected and validated by the Rogers Commission, we’ll break down the incident into its cause-and-effect relationships using a visual form of root cause analysis, the Cause Map diagram.
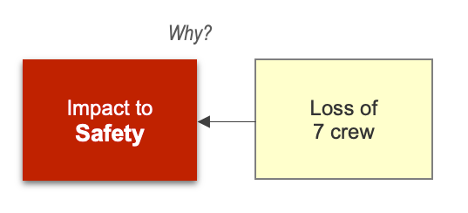
For the Challenger mission, the safety goal was affected because seven astronauts lost their lives. This is the first cause-and-effect relationship, called a 1-Why. We begin with the effect on the left, and then ask, “Why?” as we move to the right. So here, we see that the safety goal was impacted. Why? Because there was a loss of seven astronauts. The 1-Why lays out like this:
Building a 5-Why for the Challenger and Incorporating Multiple Perspectives
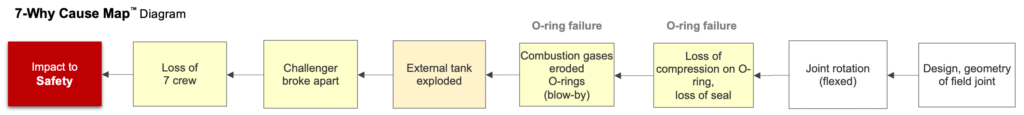
The analysis continues by asking more Why questions moving to the right. The astronauts’ deaths were due to the loss of Challenger, which was caused by an external tank explosion. The space shuttle broke apart because gasses in the external fuel tank mixed, exploded and tore the space shuttle apart. The external fuel tank exploded after the right solid rocket booster came loose and ruptured the tank. Why? Because hot gasses and flames leaking out of the rocket booster burned a hole into the external fuel tank and the piece that held the rocket booster onto the shuttle. Why were hot gases leaking out of the rocket booster? Because a seal around the O-ring (a piece of the rocket boosters) failed. Why did the primary O-ring fail? And on and on. This can be visualized with a straight-line 5-Why Cause Map diagram.
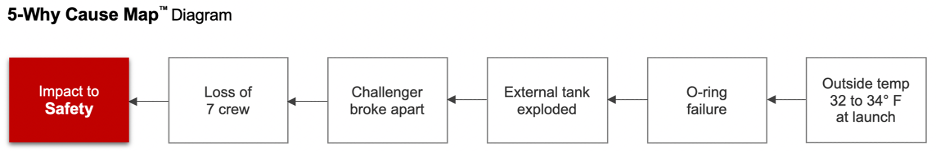
The above 5-Why does not point to the root cause of the Challenger explosion. There is nothing special about the fifth Why except that it’s between the fourth and sixth Whys. A 5-Why allows you to capture some of the cause-and-effect relationships within the incident. It is accurate, not complete.
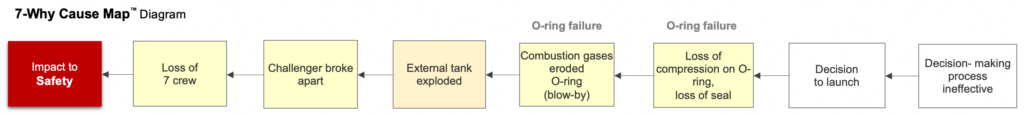
As you’re working through the Challenger case study or another incident example, you may notice there can be different views of an incident and why it happened. Another person analyzing the Challenger disaster may argue the 5-Why should look something like this:
Rather than argue the point, notice that both 5-Why examples above are accurate and based on evidence. There is no right 5-Why. There is no right answer. The simple 5-Why Cause Map diagram allows us to incorporate multiple perspectives and gives us a place to start a more in-depth analysis.
Expand to Include Multiple Causal Paths
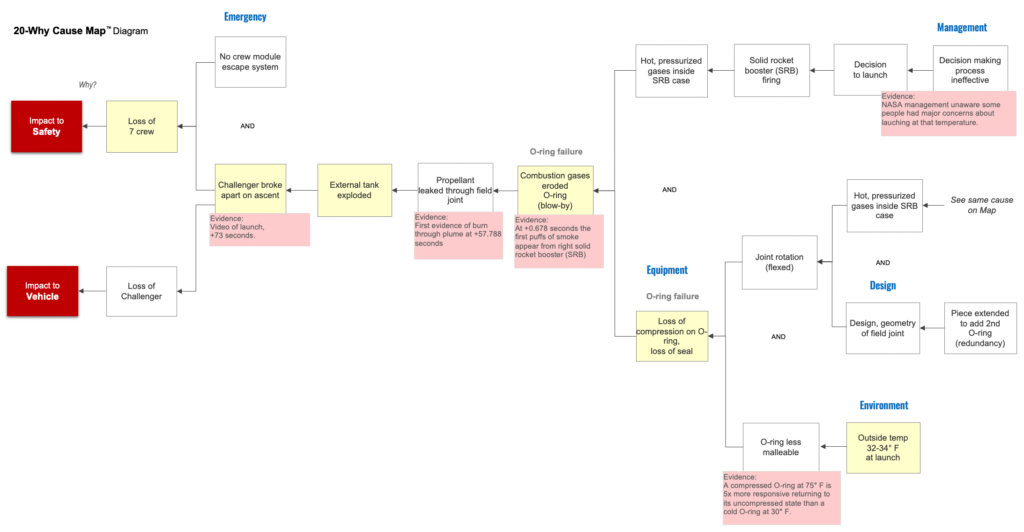
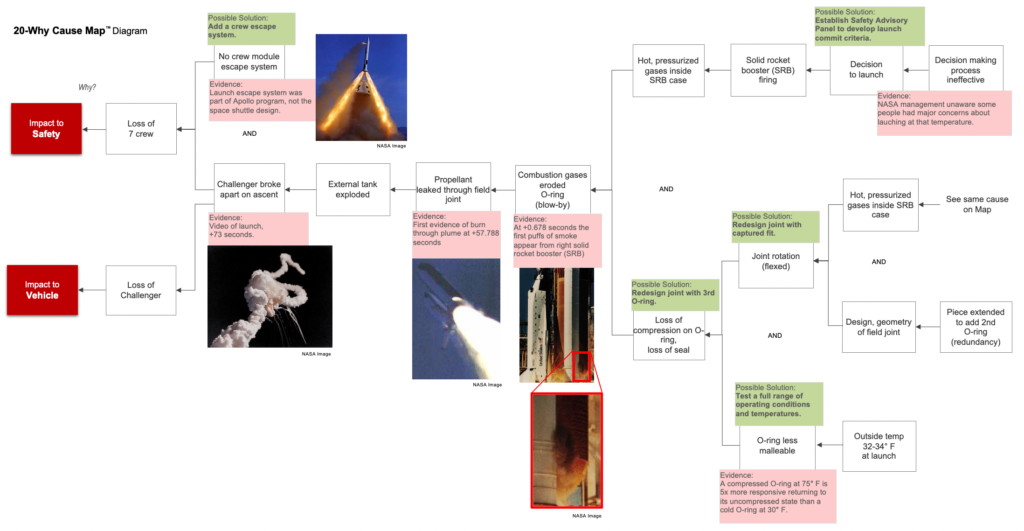
At first glance, it may appear that cause-and-effect analysis is too basic to adequately document an incident of this magnitude. But as the investigation continues, we learn more details and collect more evidence to validate and understand what happened. Cause-and-effect relationships validated with evidence reveal why things are the way they are. For decades, conventional root cause analysis has defined a root cause as a special type of cause. Cause and effect naturally splits into multiple causal paths when more than one cause is required to produce an effect. Because more than one cause is required, we place the causes in parallel with an “AND” between. Here, we see that the straight-line 5-Why Cause Map diagrams shown above can combine into one larger, more detailed Map with multiple causal paths.
Visual, Evidence-Based Analysis
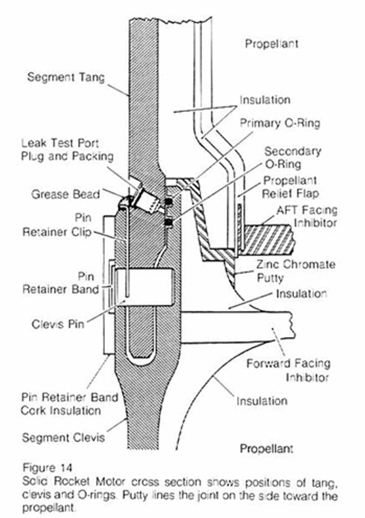
As more evidence was collected, investigators learned there was a fundamental design flaw in the solid rocket booster to which engineers had grown accustomed. Here, we can ask why the flaw had not been corrected since its discovery in 1977. Because of the flaw, it was not uncommon for the booster casing to balloon under the stress of ignition, causing the metal parts of the casing to bend away from each other, creating gaps through which hot gases could leak. In prior instances, the primary O-ring would shift out of its groove and form a seal. This process is called extrusion and the hot gases escaping is called blow-by. The evidence of previous issues with O-ring erosion and blow-by can be captured directly on the Cause Map diagram.
The more time it takes for extrusion to occur, however, the greater the damage to the O-rings. This brings us to the most immediate reason for the O-ring failure: the low temperatures at launch caused the O-rings to harden. On the morning of the launch, the cold weather lengthened the time of extrusion and hardened the O-ring, which could not form a seal in time.
Finally, the primary O-ring blow-by (the escape of hot gas) occurred because the O-ring hardened and did not fully seal at the low temperatures and because the decision was made to launch in low temperatures, despite the fact that the vehicle was never certified to operate in temperatures that low. This decision was found to have been made because of ineffective launch commit criteria.
As investigators collect more information and learn more details about the causes leading up to the disaster, those causes should be included in the Map. As the Cause Map diagram expands, investigators get a more thorough understanding of the incident, which will result in additional solution opportunities.
Incorporating Human Error and Company Culture in Your Analysis
As we continue to ask questions about the launch criteria and the known rocket booster design flaw, we back into issues often categorized broadly as problematic organizational culture, management decision-making and even human error. The Cause Map diagram incorporates these issues because they are also causes of the Challenger’s loss. A thorough analysis includes all of the causes, whether related to equipment, training or culture.
Rather than finding a “root cause,” preventing these unplanned events requires an understanding of their causes. The causes of a problem are control points for solutions. If you miss some of the causes, you’ll miss some of the possible solutions. A thorough cause-and-effect analysis provides access to a range of solution options—from the O-ring design to frontline feedback processes to launch commit criteria.
Step 3: Select the Best Solutions to Reduce the Risk of Recurrence
Once the Cause Map diagram is built to a sufficient level of detail with supporting evidence, problem solvers can begin to determine possible solutions. The Cause Map diagram is used to identify all possible solutions for a given issue, so the best solutions can be selected and implemented.
A detailed Cause Map diagram is a tool to identify more effective, actionable solutions. These can be documented directly on the Cause Map diagram. They’re typically placed in a green box directly above the cause the solution controls. At this stage, all solutions are considered and documented on the Cause Map diagram. After the analysis is complete, the best solutions should be selected based on their impact to the organization’s goals. Selecting and implementing more than one solution provides an opportunity for a greater reduction in risk, adding layers of protection.
Test the Cause Mapping Method on Your Problems
Grounded in the basics of cause and effect, the Cause Mapping method of root cause analysis is a simple and effective method for investigating safety, environmental, compliance, customer, production, equipment or service issues. It can be applied consistently to day-to-day as well as catastrophic issues. The Cause Map diagrams included here were built using our Cause Mapping investigation template in Microsoft Excel, which you can download for free.
Interested in learning more? Consider joining one of our upcoming free webinars, online short courses or full Cause Mapping workshops.

Unfortunately, NASA has had other fatal space incidents. If you’re interested in learning more about those and the lessons learned through use of the Cause Map diagram, you can see our root cause analysis of the Apollo 1 fire here and the Columbia breakup here.